On a whim, I took a day off to explore this niche museum I’d stumbled upon. It’s part of the Zhejiang Academy of Surveying and Mapping Science and Technology. I didn’t expect much, planning just a quick look, but the quality was surprisingly high. The very first exhibit had me hooked.
The museum spans two floors. The first floor traces the history of Chinese surveying and mapping from ancient to modern times. The second floor features two halls: one on modern applications of surveying and GIS (Geographic Information System), and another on maps. The GIS hall is packed with interactive, kid-friendly exhibits.
Time was short—just one morning—so I snapped as many photos as I could to pore over later, though I still missed most of it. Anyway, let’s take a quick virtual tour.
Ancient Chinese Surveying and Mapping
The first hall on ancient surveying techniques posed a question we moderns rarely consider: without rigorous science like geometry, did early humans rely purely on intuition?
Absolutely not.
While our perception can be vague, interacting with the physical world demands precision. The laws of physics make quantitative measurement a necessity.
Vertical Surveying
Take well-digging. The ancients couldn’t just dig on a whim. A well had to be perfectly vertical to prevent collapse and make drawing water easier. They might not have known about gravity, but they understood that a hanging weight points straight down.
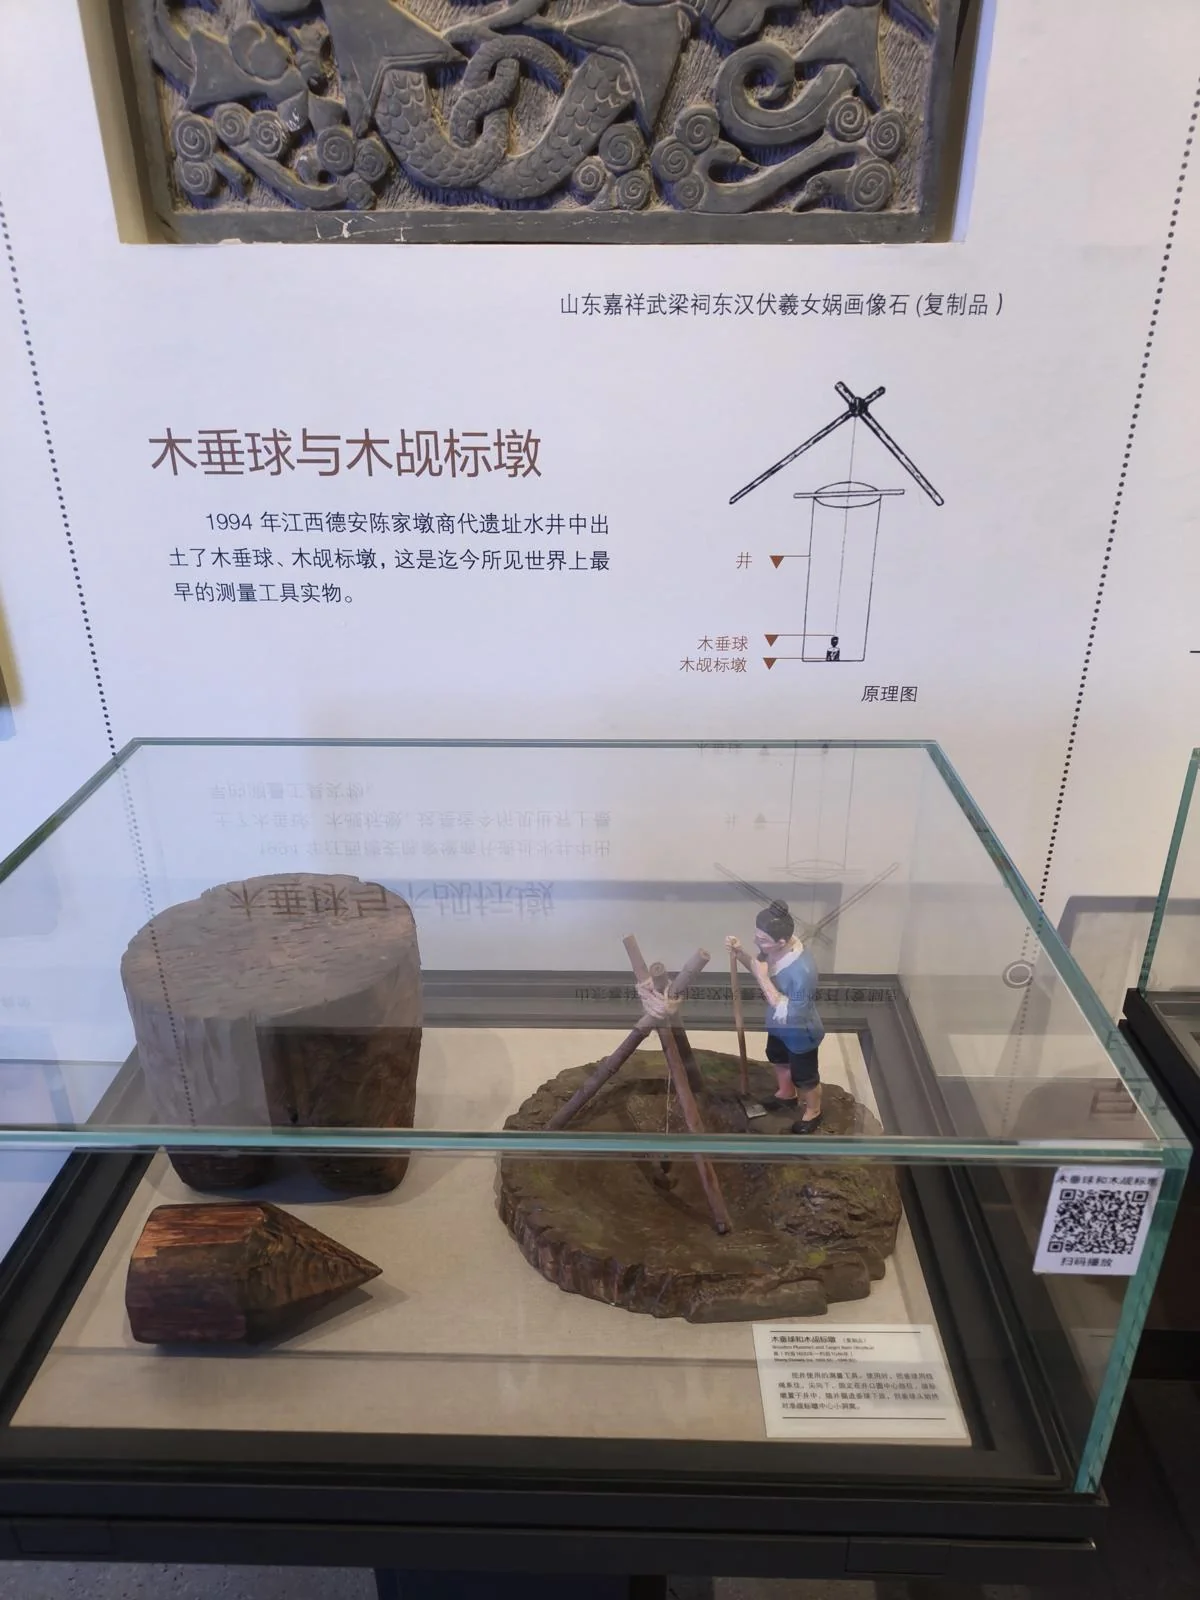
The pointed piece of wood in the bottom left is a plumb bob, suspended by a rope from the well’s center. The large wooden stake next to it is a sighting pile. It’s hard to see through the glass, but there’s a small hollow carved in its top. While digging, they kept the plumb bob pointing at that hollow. As the well deepened, the rope lengthened, and the sighting pile was moved lower. With this setup, they could keep the well perfectly vertical, as shown in the diagram.
This simple setup was the world’s earliest surveying tool. This method is still used in construction today. You’ve probably heard of it: the plumb line.
Horizontal Surveying
While gravity makes finding ‘up’ and ‘down’ easy, the horizontal plane is trickier to measure precisely.
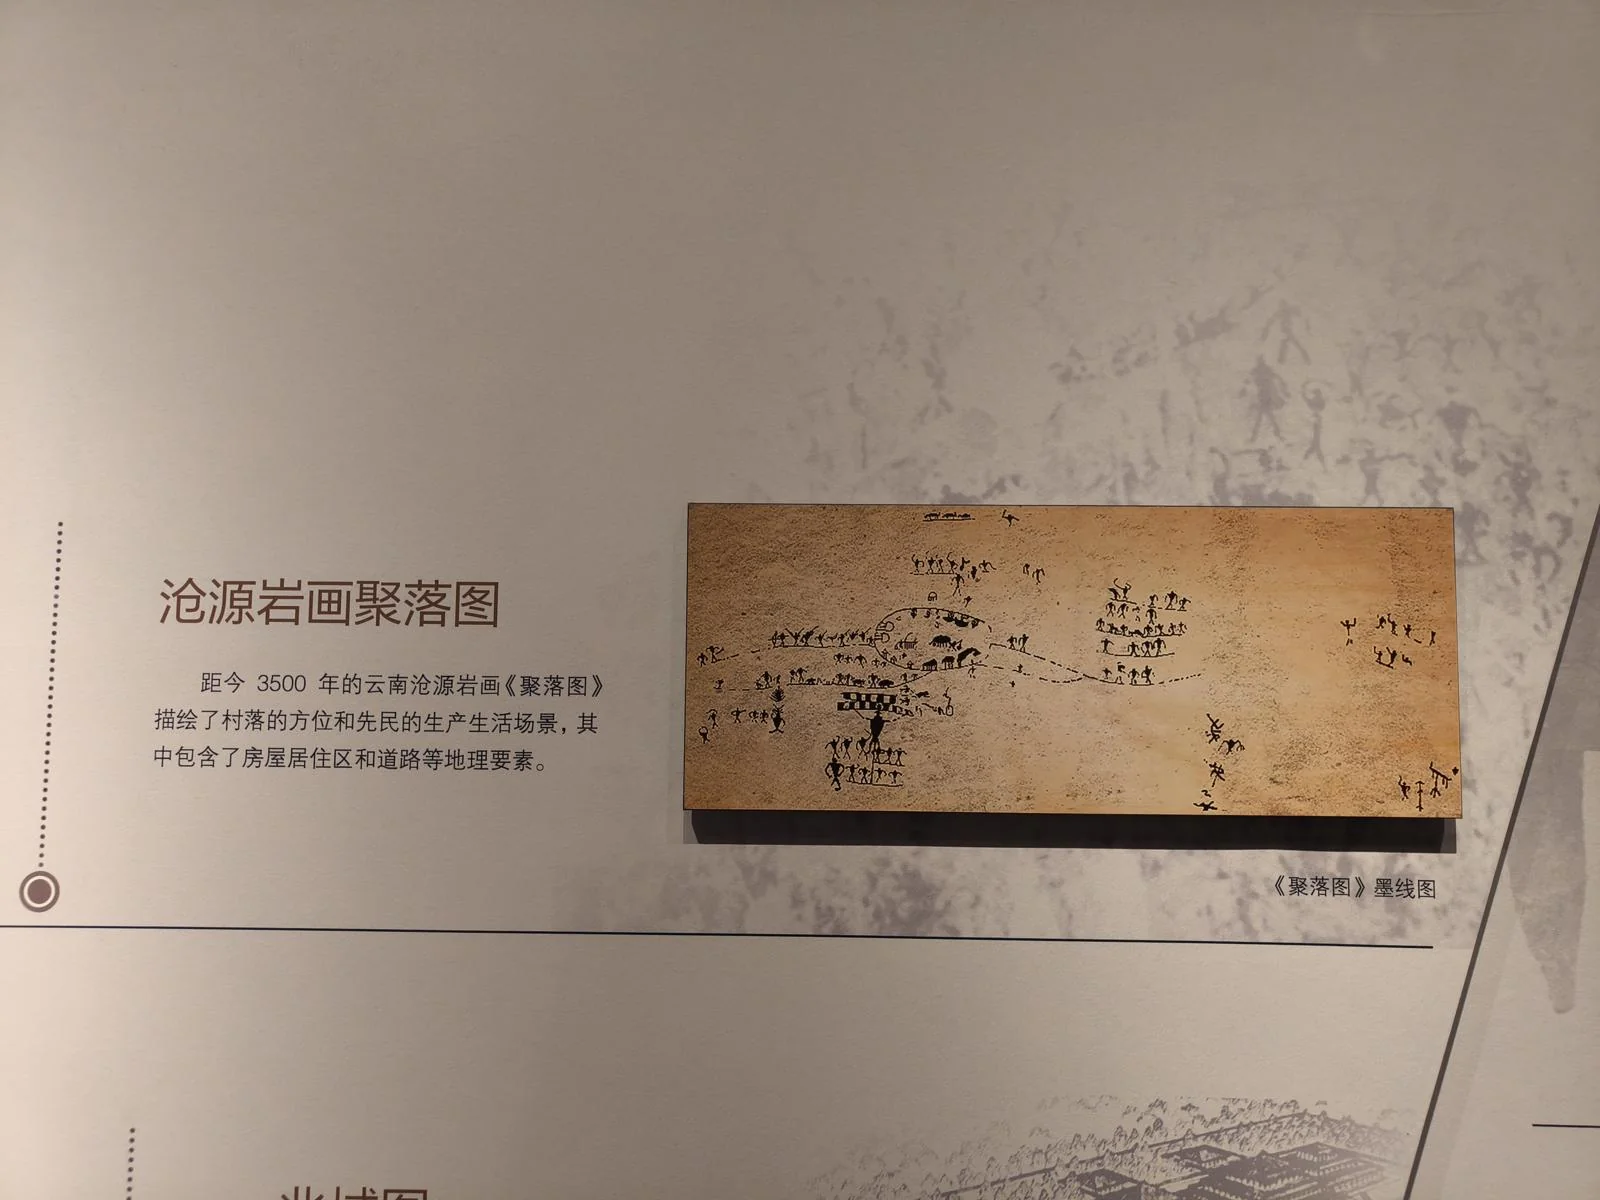
This is where maps come in. Cave paintings weren’t just art; alongside scenes of daily life and belief, ancient people drew highly practical maps.
This 3,500-year-old rock painting of a settlement in Cangyuan, Yunnan, shows the distribution of houses and roads—an abstraction of the physical world.
The further I walked, the more I appreciated the genius of the map. As land-bound creatures who can’t fly, our world is essentially two-dimensional. We don’t burrow underground or float in the air, so it’s natural to represent our world on a flat surface, ignoring altitude and focusing on the cardinal directions.
A map is the ultimate tool for filtering key information from the noise of the natural world. A tribal chief cared where the houses, roads, and livestock were, but not how many trees were in a certain area.
From Qualitative to Quantitative
But the Cangyuan rock painting is purely qualitative. It shows a house is near a road, but not how far. It doesn’t tell us which of two houses is closer.
Why does this matter? Without quantitative data, we can’t make comparisons at scales beyond what the eye can see.
We understand the world through comparison, relating new concepts to what we already know. By spotting similarities and differences, we learn.
For example, if I tell you the Earth’s circumference is 40,000 kilometers, the number is too big to grasp. But if I say that light can circle the Earth 7.5 times per second, you get it. The fastest thing we know takes a noticeable amount of time to circle our planet, which means Earth is immense.
That 7.5 is a quantitative expression. Numbers allow for comparison, and using math to measure the world frees us from vague intuition.
To compare numbers, they must share the same units. Which is longer, one meter or one zhang? Without a conversion, nobody knows. Standardizing units unifies a country’s mathematical language. Yes, math has dialects: calculation methods are grammar, and units are pronunciation. When everyone speaks the same mathematical language, people from different regions can trade more easily or collaborate on building the Great Wall, enabling the efficient flow of resources.
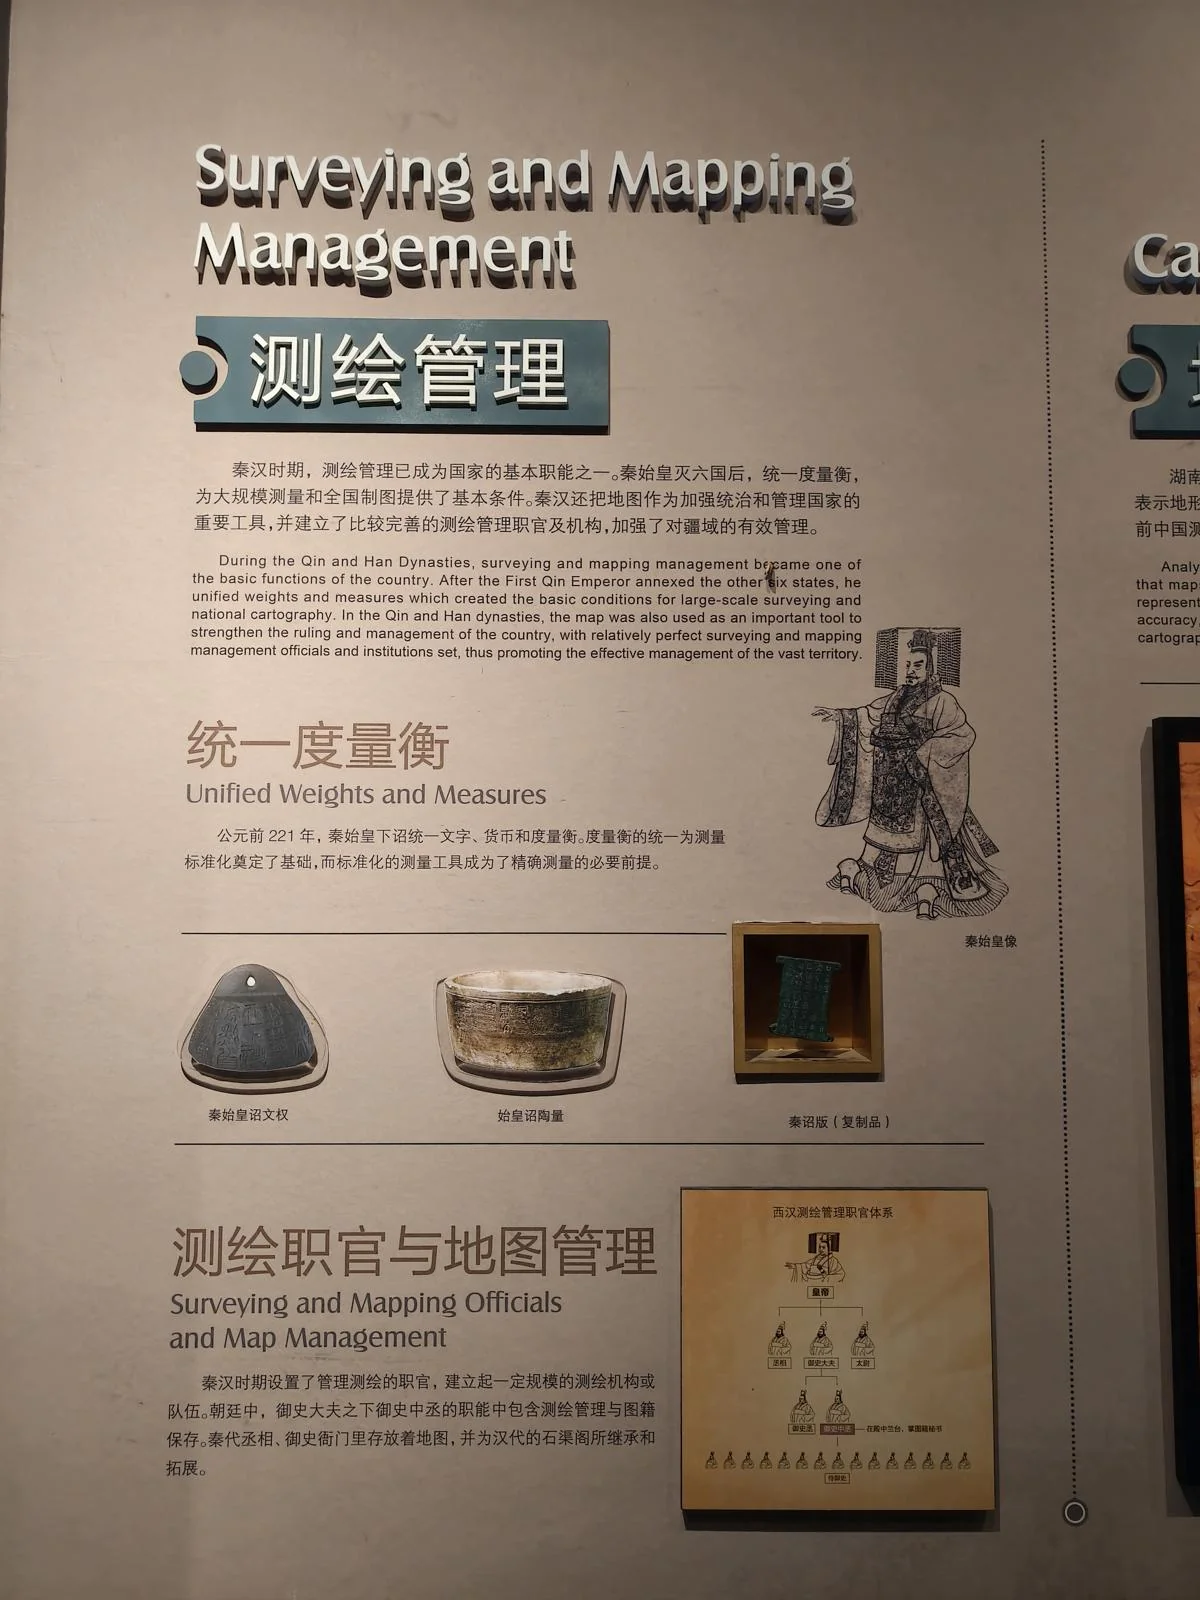
This puts Emperor Qin Shi Huang’s standardization of weights and measures in a new light. It wasn’t just a grand gesture; it was a practical necessity for ruling a vast empire.
The exhibit also revealed something I’d never considered: the Qin Dynasty had officials specifically in charge of surveying and cartography. This shows how crucial these tasks were to the state; at such a macro level, no decision could be based on feeling alone.
With standardized units and measurement techniques, it became possible to shrink vast territories onto small maps.
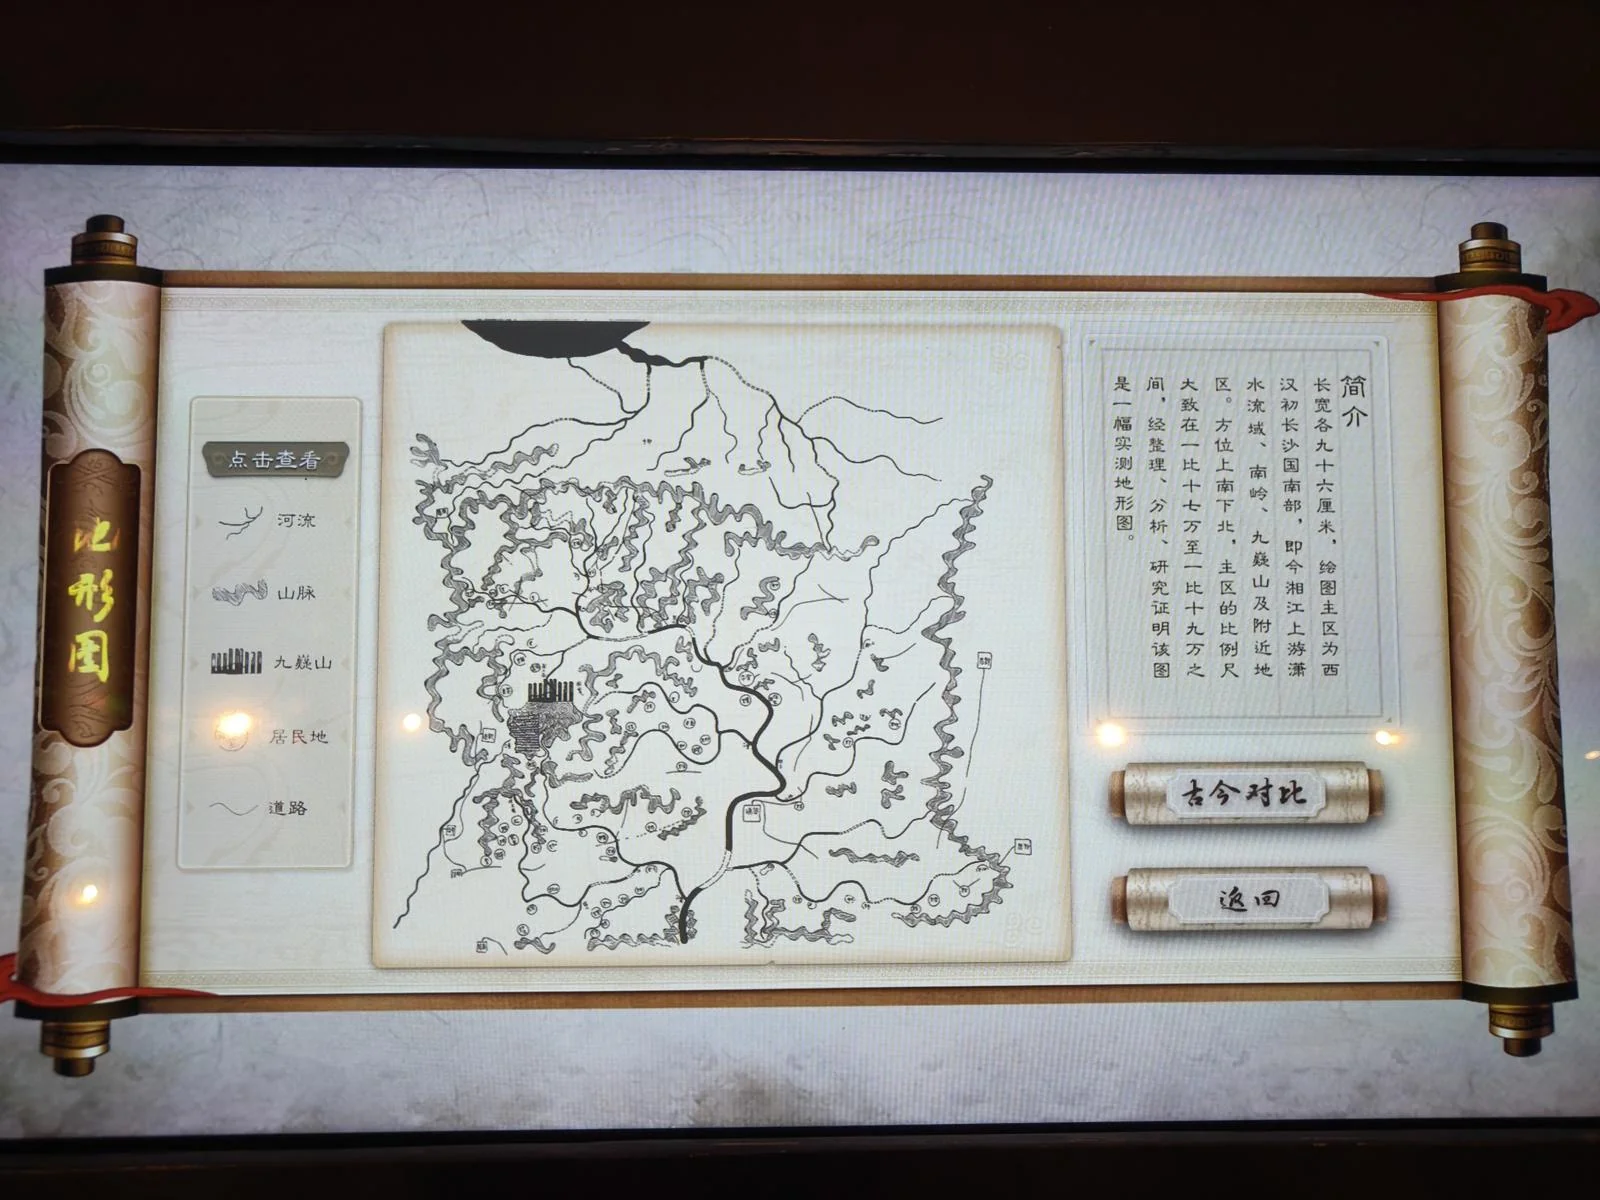
A topographic map from Mawangdui Tomb No. 3. I’ve transcribed the description:
Measuring 96x96 cm, it depicts the southern part of the Changsha Kingdom in the early Western Han Dynasty, now the upper Xiang River, the Nanling and Jiuyi Mountains, and surrounding areas. The orientation is south-up. The scale is roughly 1:170,000 to 1:190,000. Analysis confirms it is a surveyed topographic map.
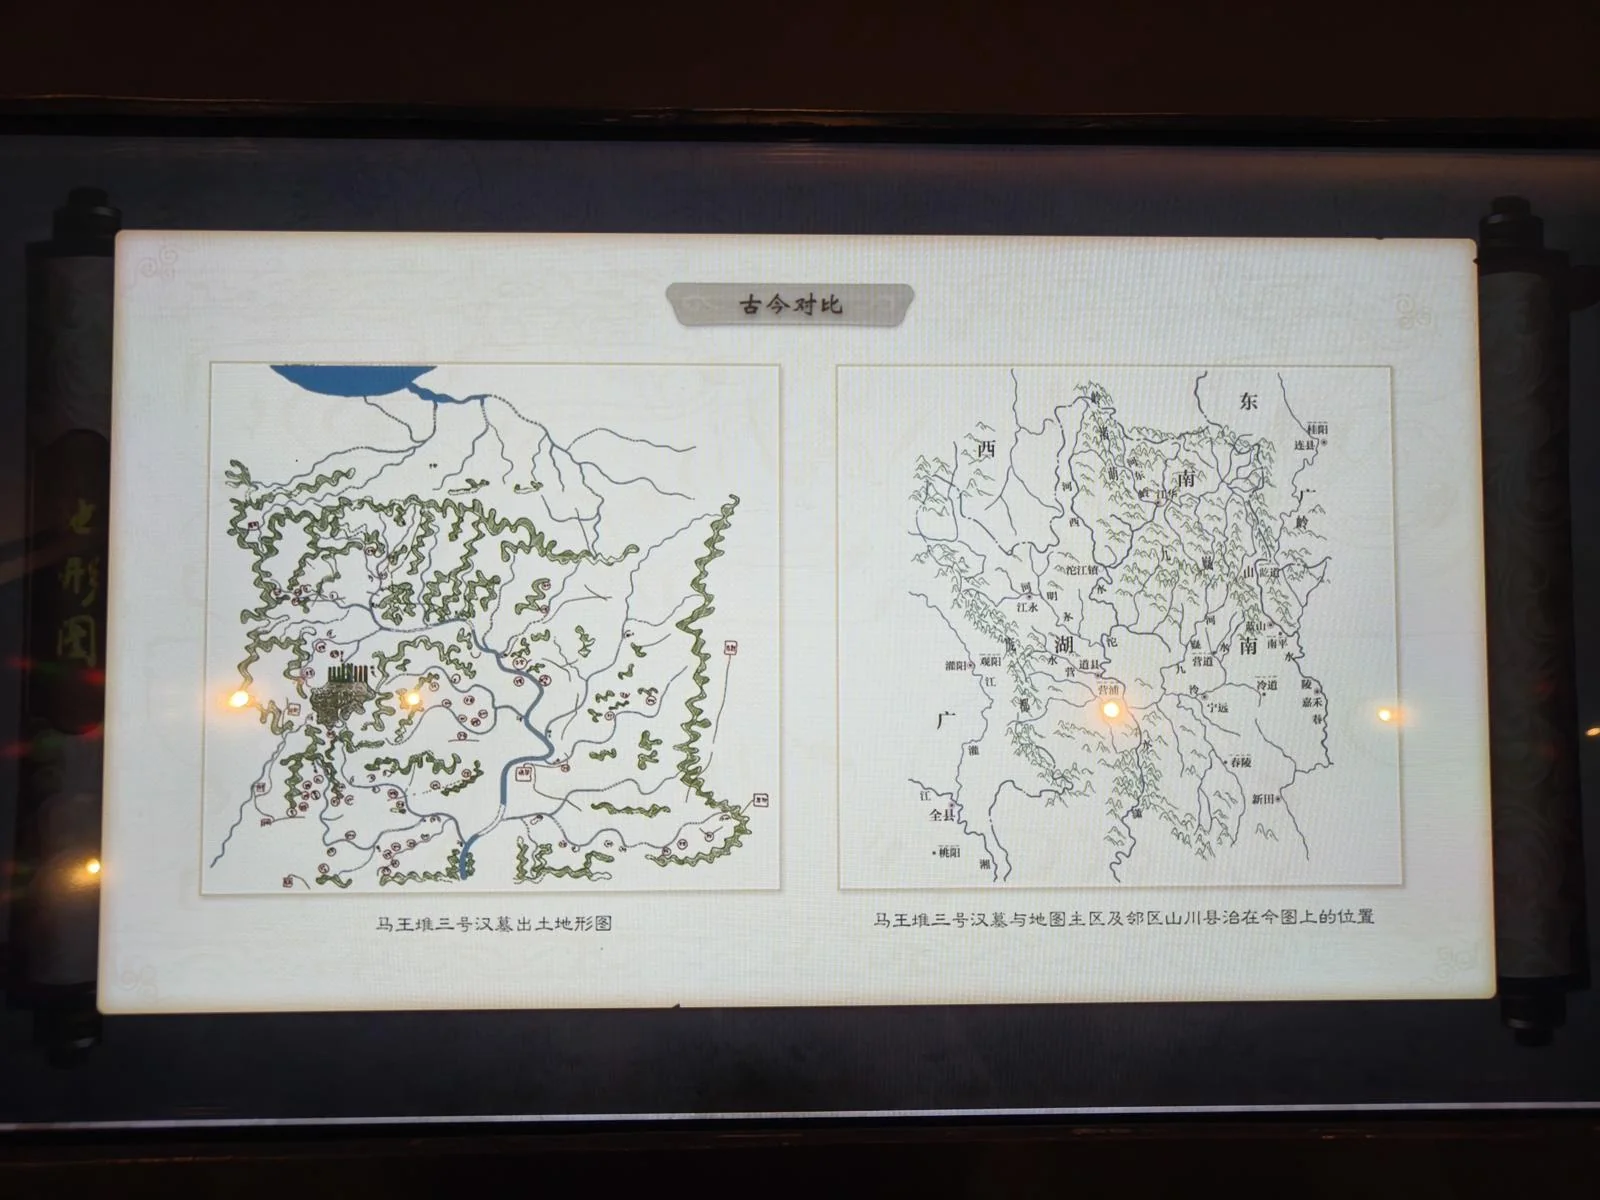
I’m not familiar with the geography of Hunan and Guangxi. Note that the Mawangdui map must be rotated 180 degrees to match modern maps. Over 2,000 years, river systems may have changed, but the mountains still seem to align well. Can any friends from Hunan or Guangxi comment on the accuracy of this Han Dynasty survey?
The Math Behind Surveying
Once surveying methods exist, someone is bound to create a science out of them.
geometry(n.)
early 14c., also gemetrie, gemetry, from Old French geometrie (12c., Modern French géométrie), from Latin geometria, from Greek geometria “measurement of earth or land; geometry,” from combining form of gē “earth, land” (see Gaia) + -metria “a measuring of” (see -metry). Old English used eorðcræft “earth-craft” as a loan-translation of Latin geometria.
The word “geometry” traces back to ancient Greece, where it meant “earth measurement.” It allowed for objective comparisons of land area, settling disputes between farmers. From such practical problems, this science of shapes emerged.
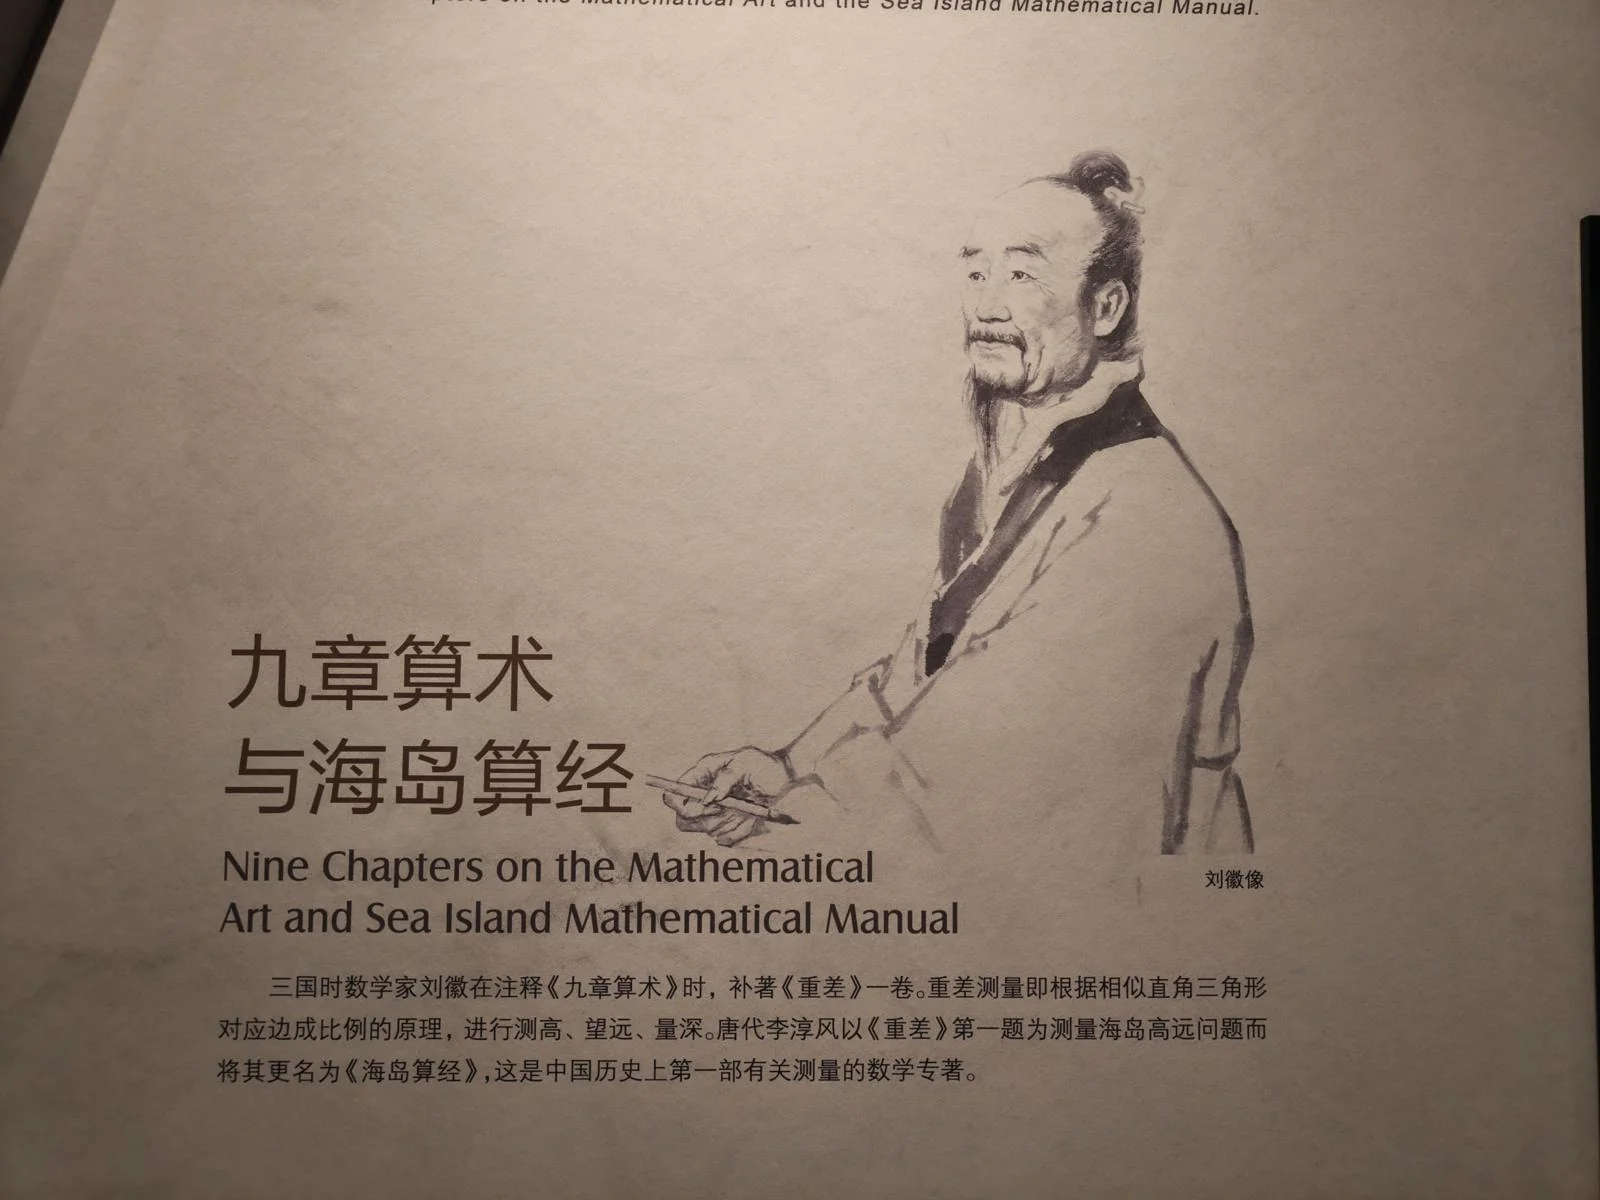
China had its own geometric pioneers. Liu Hui, a mathematician of the Three Kingdoms period, wrote a treatise on measuring the height of a sea island in his commentary on the Nine Chapters on the Mathematical Art. It systematically used the principle of similar triangles to remotely measure an island’s height without setting foot on it. This was China’s first mathematical work on surveying.
Measuring a sea island might sound trivial, but it freed surveyors from physical constraints, enabling the remote measurement of large, distant objects. The principle of similar triangles is foundational to modern astronomy.
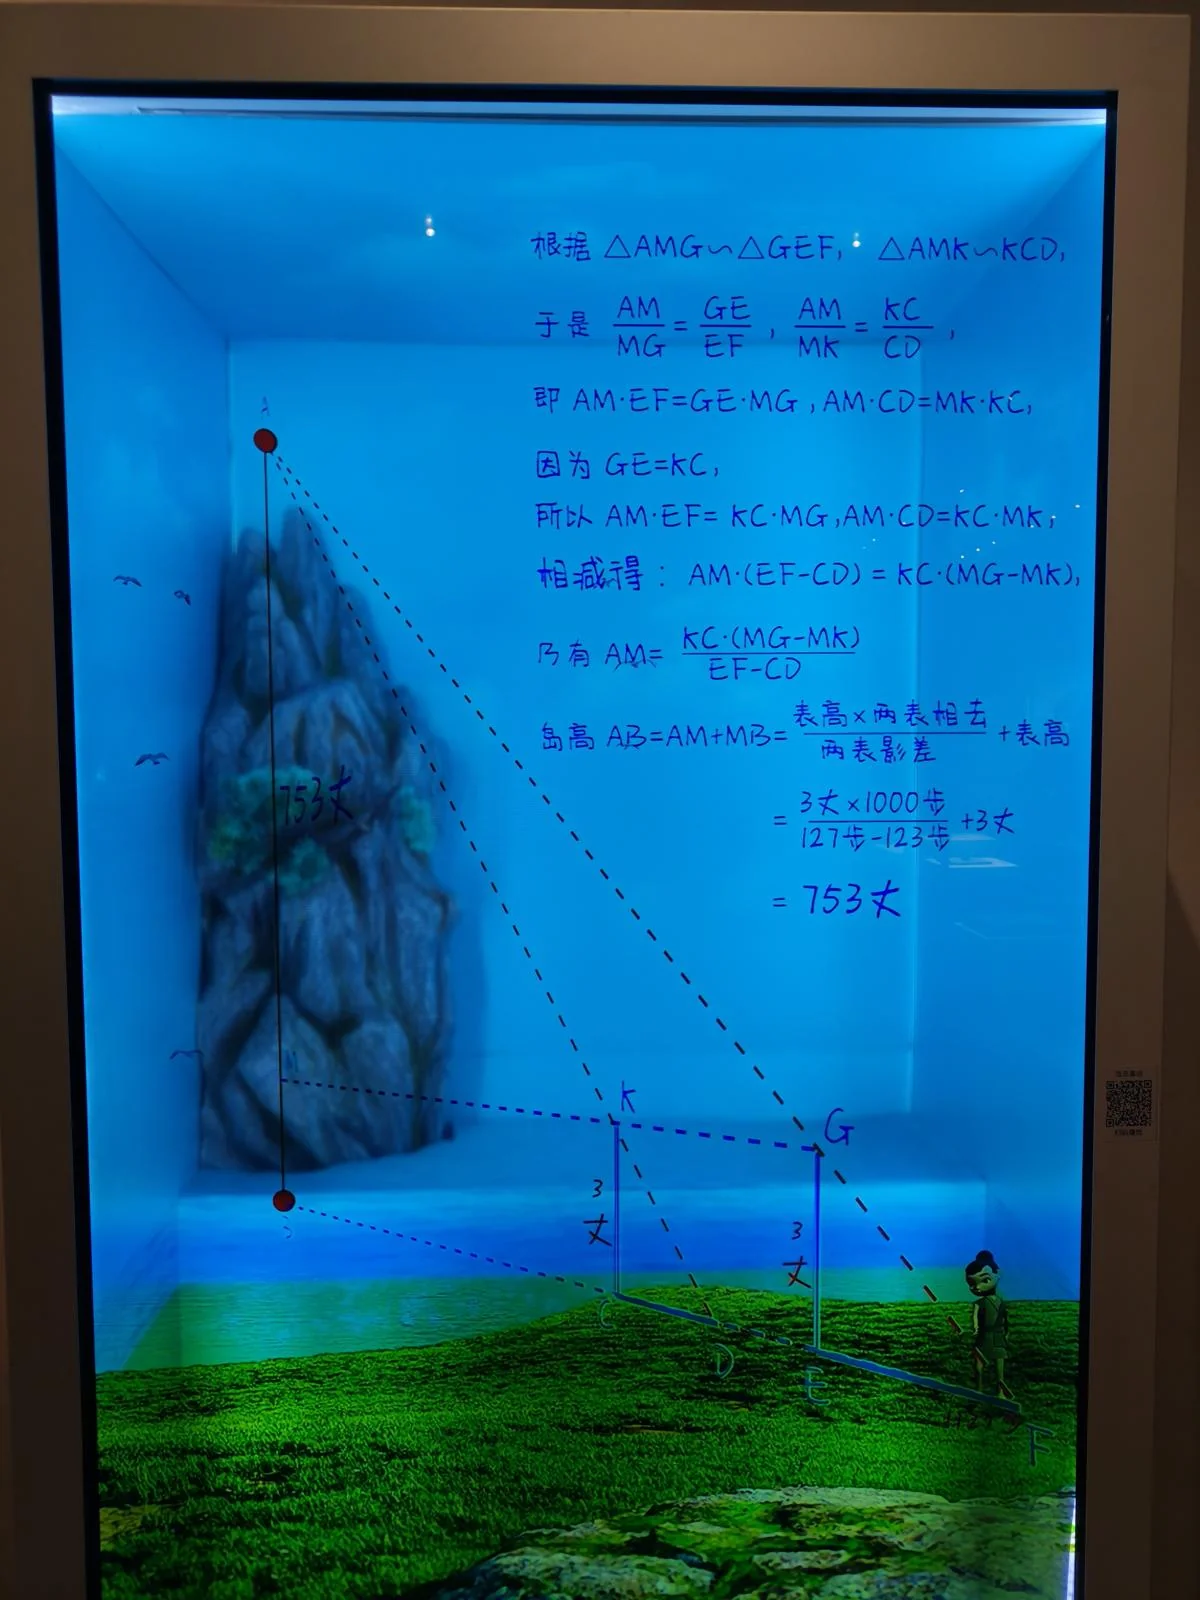
A nearby interactive exhibit demonstrated the principle. Tapping the screen showed an ancient cartoon figure with a pole, taking a few measurements to get the result.
Place a pole of known height, step back until its top visually aligns with the island peak, and record the horizontal distance to the pole. That creates a small right triangle (eye–pole top–pole base) similar to the large triangle (eye–island peak–island base). One sighting gives a ratio between height and distance but leaves both unknown. Repeat from a second spot farther out along the same sightline with another pole and measure the separation between the two pole positions. Those two similar-triangle equations plus the known separation give two equations for two unknowns, allowing you to solve for the island’s height and distance.
So, not only is the island’s height calculated, but the distance to it is found as well.
Measuring Water Levels: The Grand Canal
With basic math, even without systematic physics, ancient people could build incredible things, like a nationwide canal.
Here’s a question: Is the water level of the 1,700-km Beijing-Hangzhou Grand Canal constant?
Impossible. The terrain varies, with some cities on high ground and others in lowlands. A canal built at a high elevation would flood low-lying cities if it leaked. Building it at a low elevation would require carving through mountains to reach higher cities.
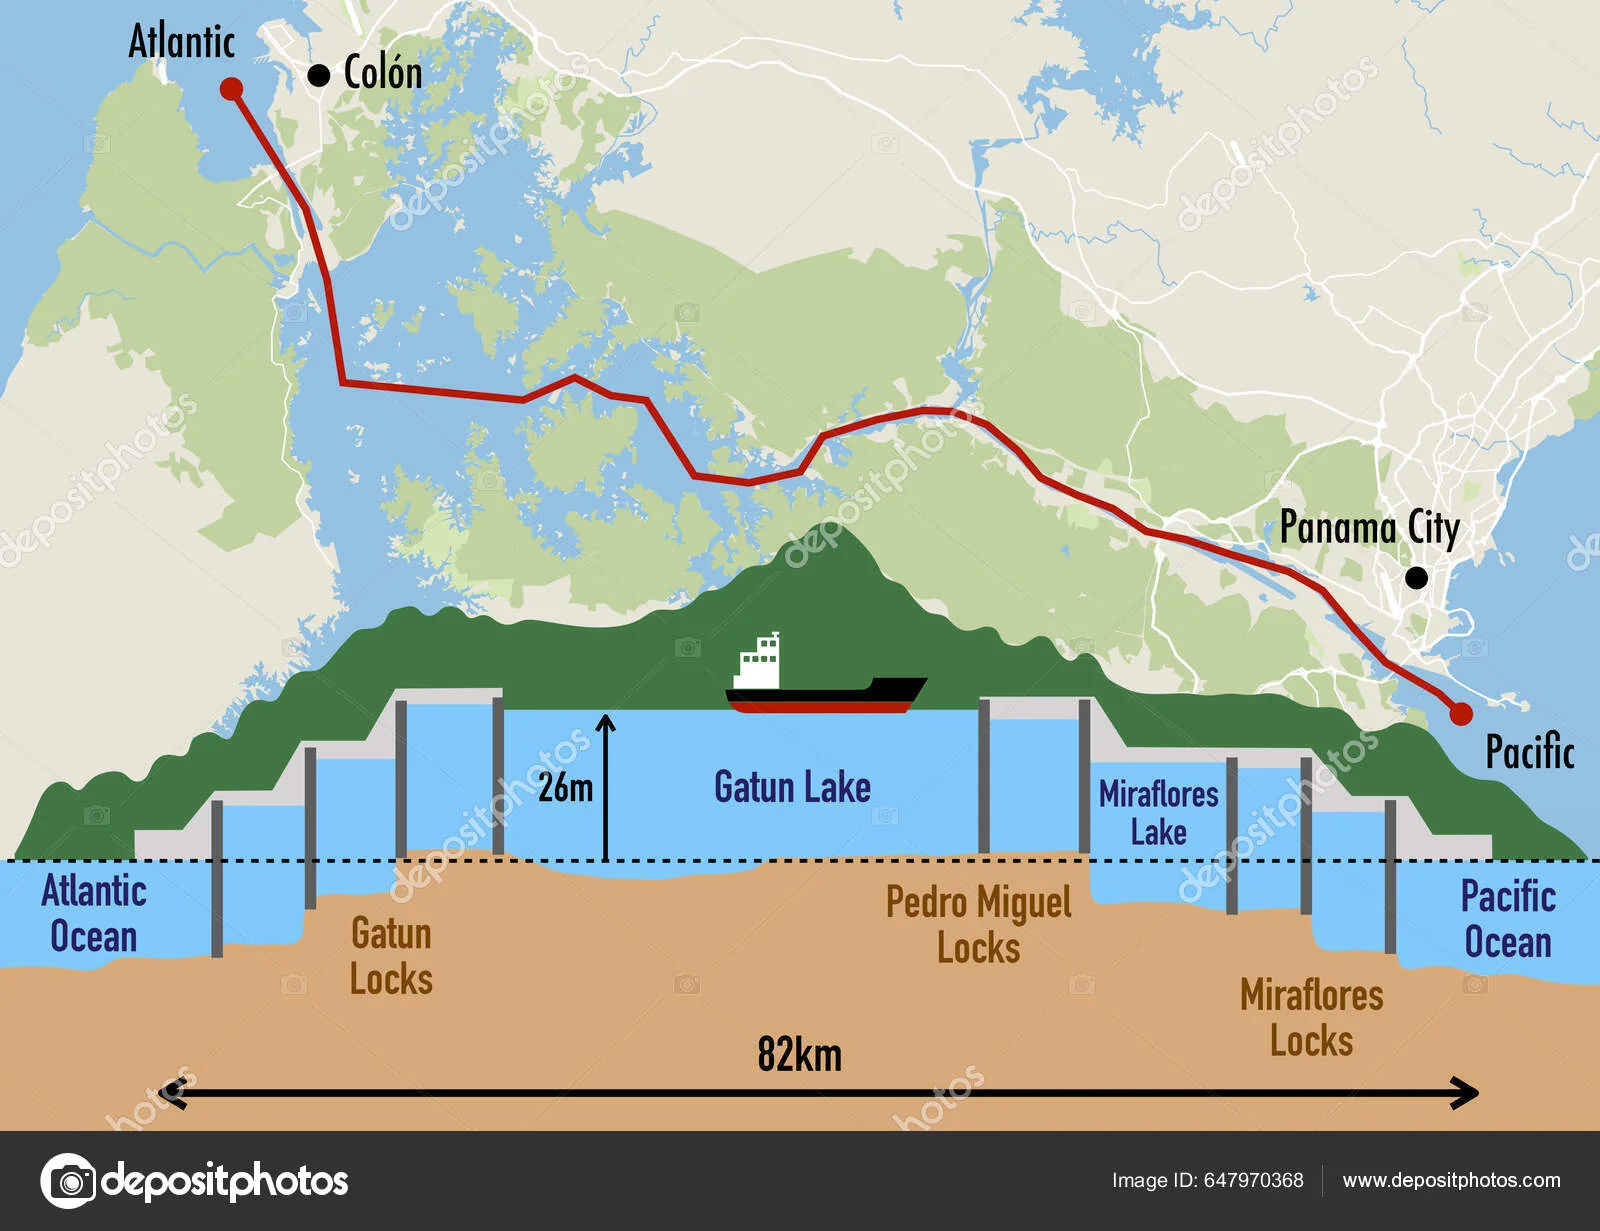
So, canals are built in sections, each with its own water level. The Panama Canal, for example, uses locks to separate segments. A chamber between two segments changes its water level. A ship enters, the gate behind it closes, and water from the next segment flows in, raising the ship to the next level. Step by step, the ship conquers the terrain.
An astute observer might ask: doesn’t water constantly flow out of the higher sections? Yes, it does. A canal isn’t a self-sustaining system; it needs external water sources to replenish the upper levels. A dry season could even shut it down.
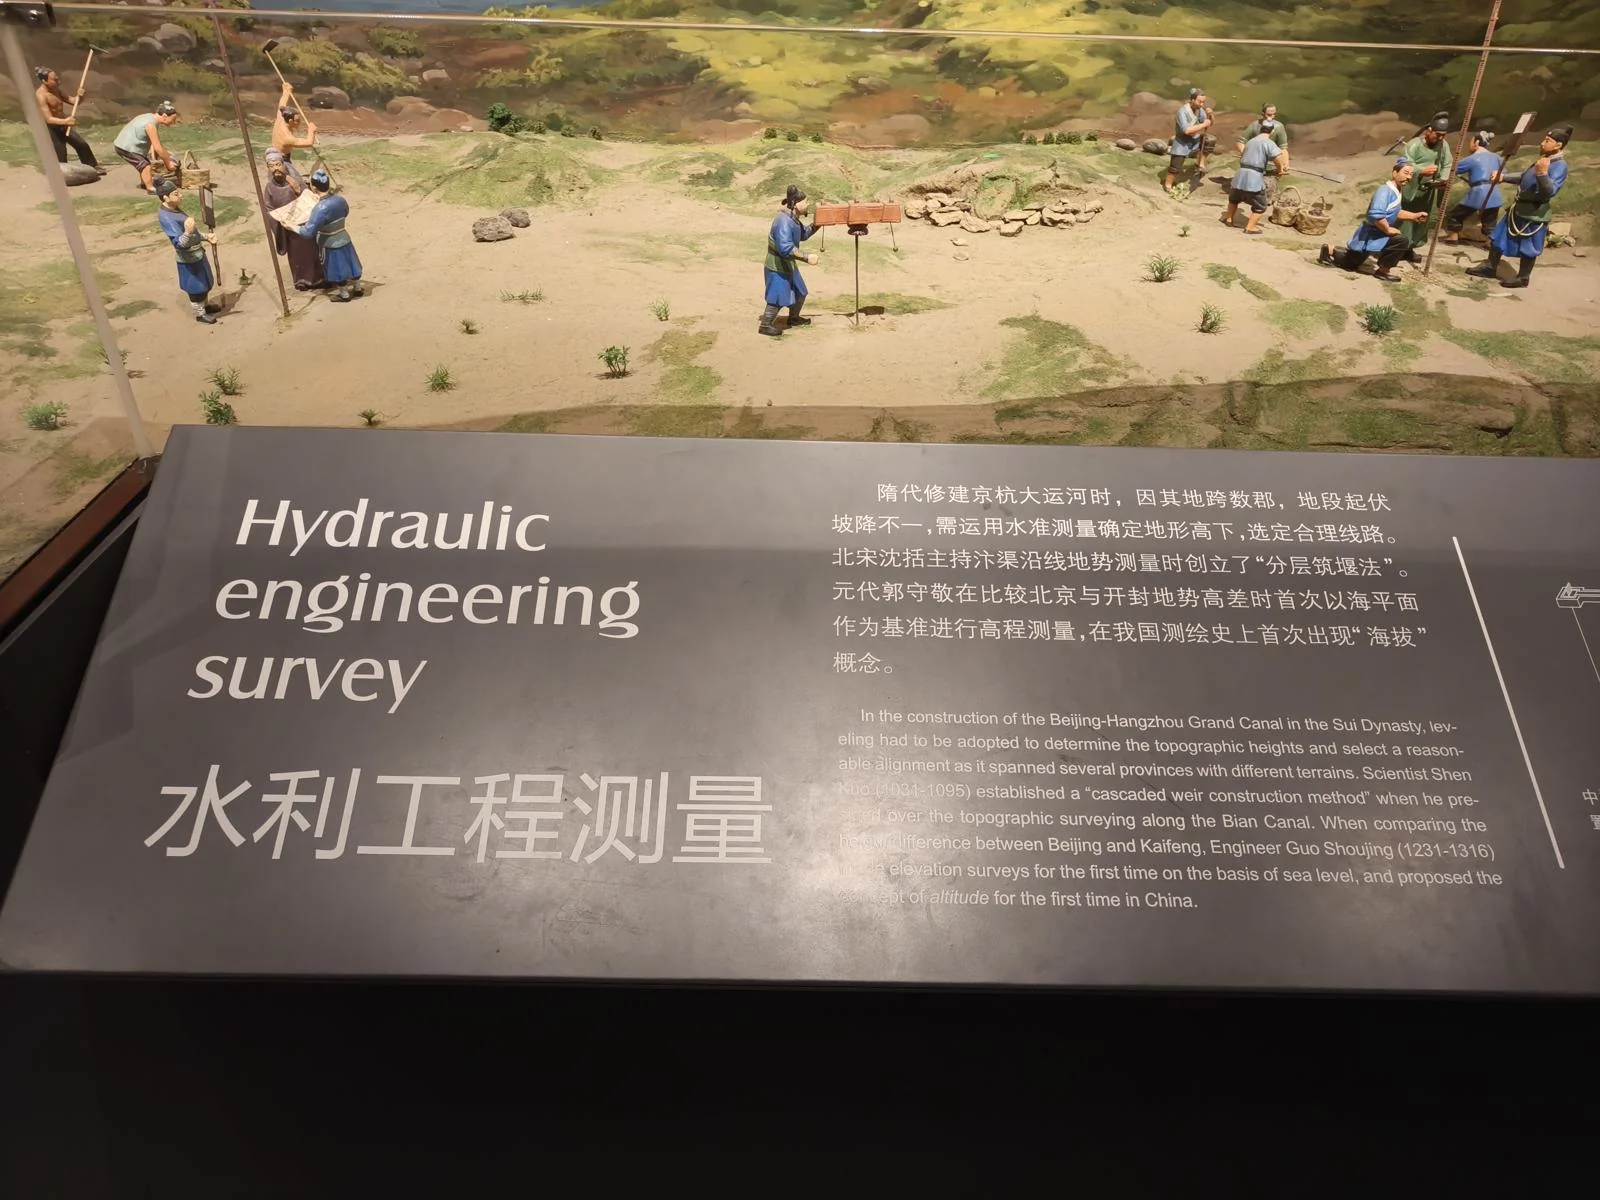
Clearly, building the Grand Canal was more than just digging a long trench. It required immense, precise surveying and calculation to find suitable routes. Guo Shoujing of the Yuan Dynasty was the first in China to use “sea level” as a baseline to compare canal sections, introducing the concept of “altitude.”
A bit of trivia: The Grand Canal was built during the Sui Dynasty, but it wasn’t the “Beijing-Hangzhou” Grand Canal at first. The Sui capital was Chang’an, and later Luoyang. A canal would have to serve the capital. The original main artery was centered on Luoyang, connecting the northern plains to the southern Jiangnan region, funneling goods to the capital.
In the later Yuan, Ming, and Qing dynasties, the political focus shifted north, and the importance of Chang’an and Luoyang faded. Massive resources were poured into the canal between Beijing and Hangzhou, which gradually became the main trunk.
I learned this from the Canal Museum by the Gongchen Bridge in Hangzhou. If you’re interested, major cities along the canal likely have their own museums documenting this history.
Measuring the Earth: The Meridian Line
Besides measuring things on the ground, the ancients also measured the Earth itself.
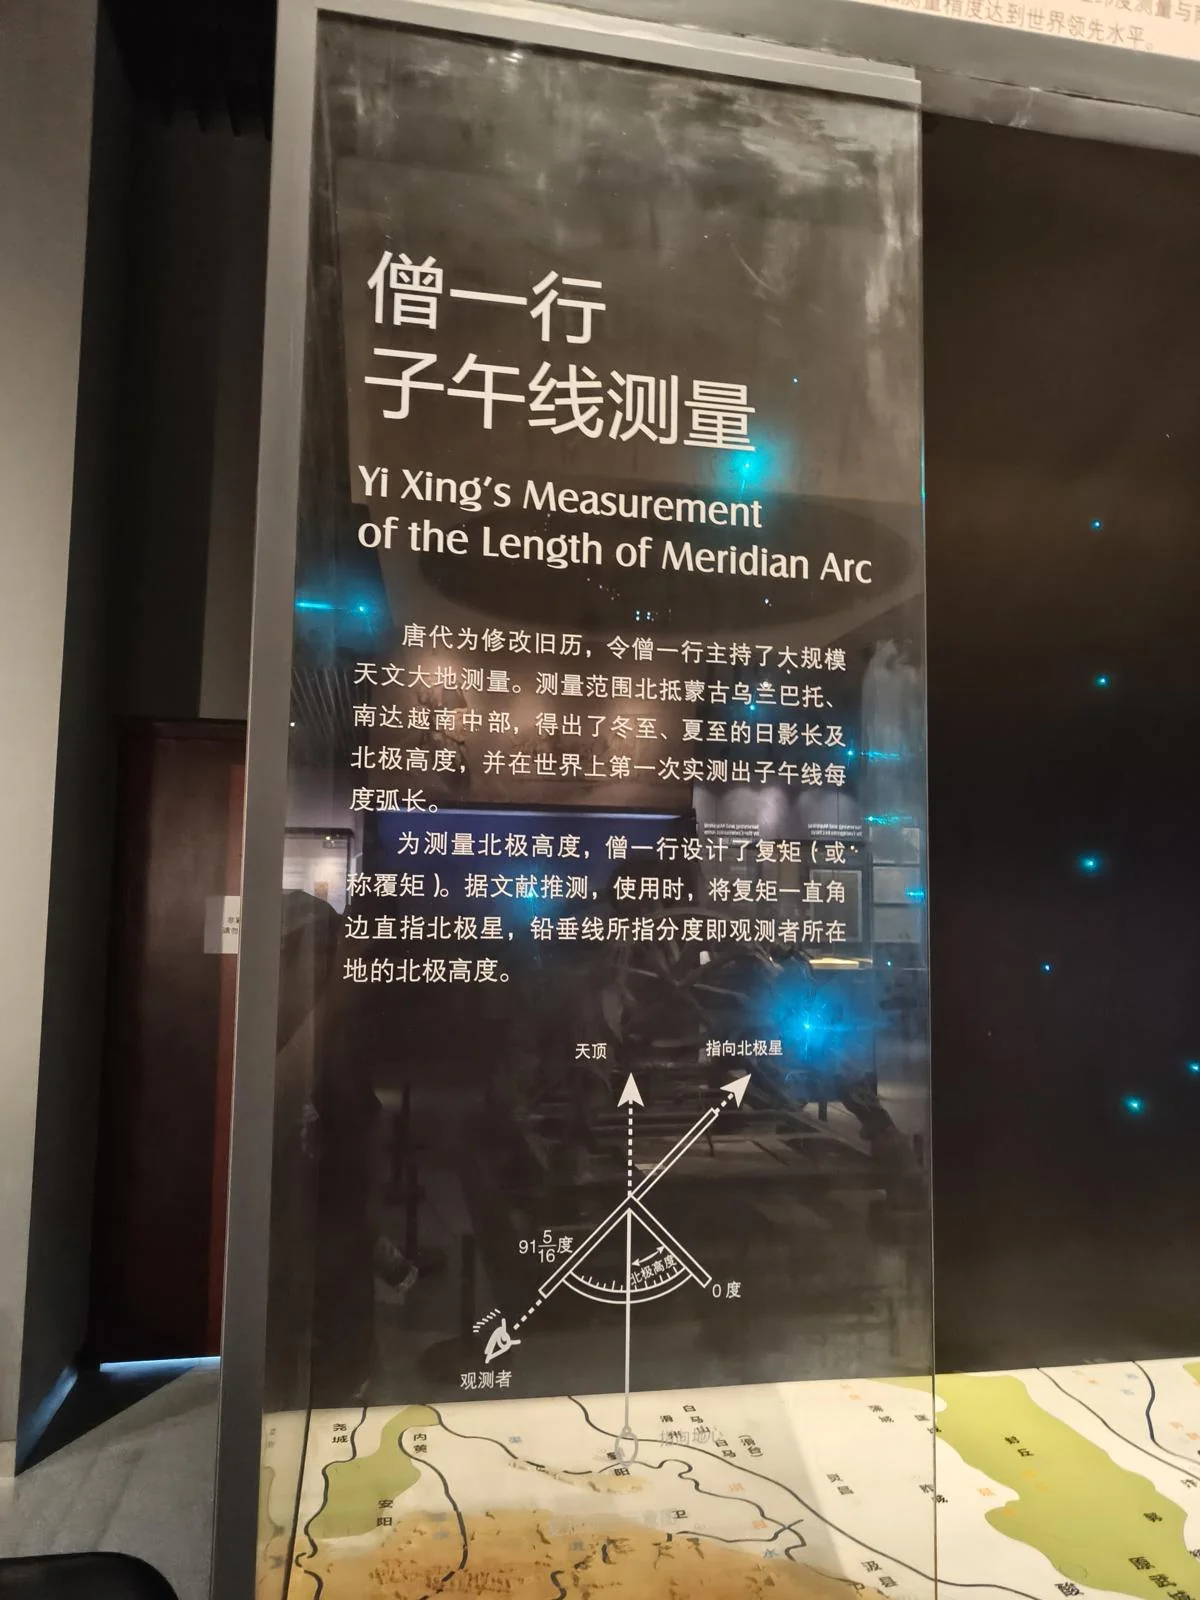
In ancient civilizations worldwide, heaven and earth were seen as connected and mutually influential. The Tang dynasty monk Yi Xing was tasked with creating a more accurate astronomical calendar to predict celestial events and guide life on Earth. He set up 13 observation stations over a vast distance, from Mongolia to Vietnam, and had his teams simultaneously measure the altitude of the North Star and the length of the noon shadow.
Because the Earth is a sphere, the North Star’s altitude and the noon shadow’s length vary with latitude. Using this data, he calculated the arc length of a degree of the meridian with the highest accuracy of his time.
In ancient China, “zi” meant north and “wu” south, so a “ziwu line” was a north-south arc on the Earth’s surface—what we call a meridian line.
The arc length of one degree of longitude is key data; it can be used to calculate the size of the Earth. This discovery could have sparked an age of exploration for China. But that didn’t happen, partly because the concept of a spherical Earth wasn’t yet widely accepted.
Measuring the Sky: The Cross-Staff
The ancients also measured the sky.
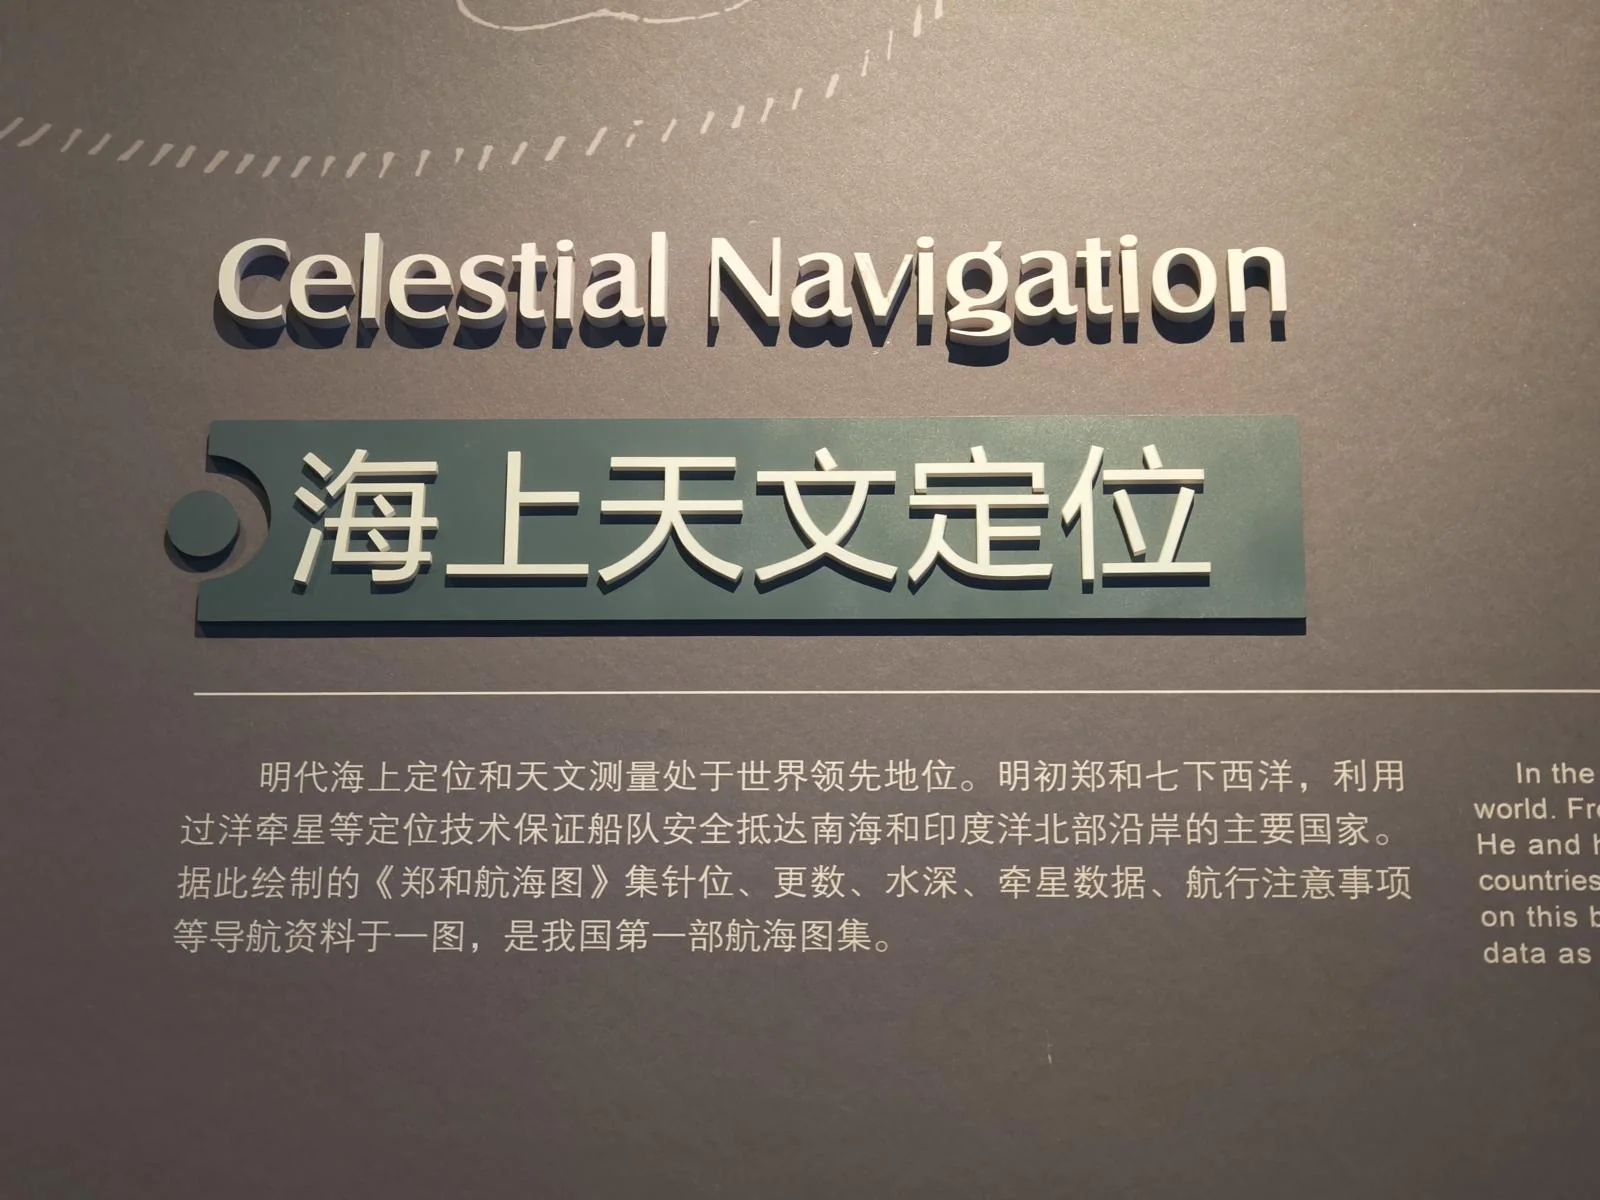
At sea, with no landmarks, the sky is the only guide. By day, you have the sun. At night, what do you have? The moon is unreliable; as Earth’s satellite, its position is too variable.
Ancient nighttime navigation relied on the stars. This worked because the distant stars form a fixed map in the sky.
Strictly speaking, stars aren’t completely fixed; their own motion and the Earth’s precession slowly change their positions. But these changes are so gradual that for ancient navigators, the stars were a stable and information-rich guide, even more so than the sun. The challenge was learning to read this celestial “map.”
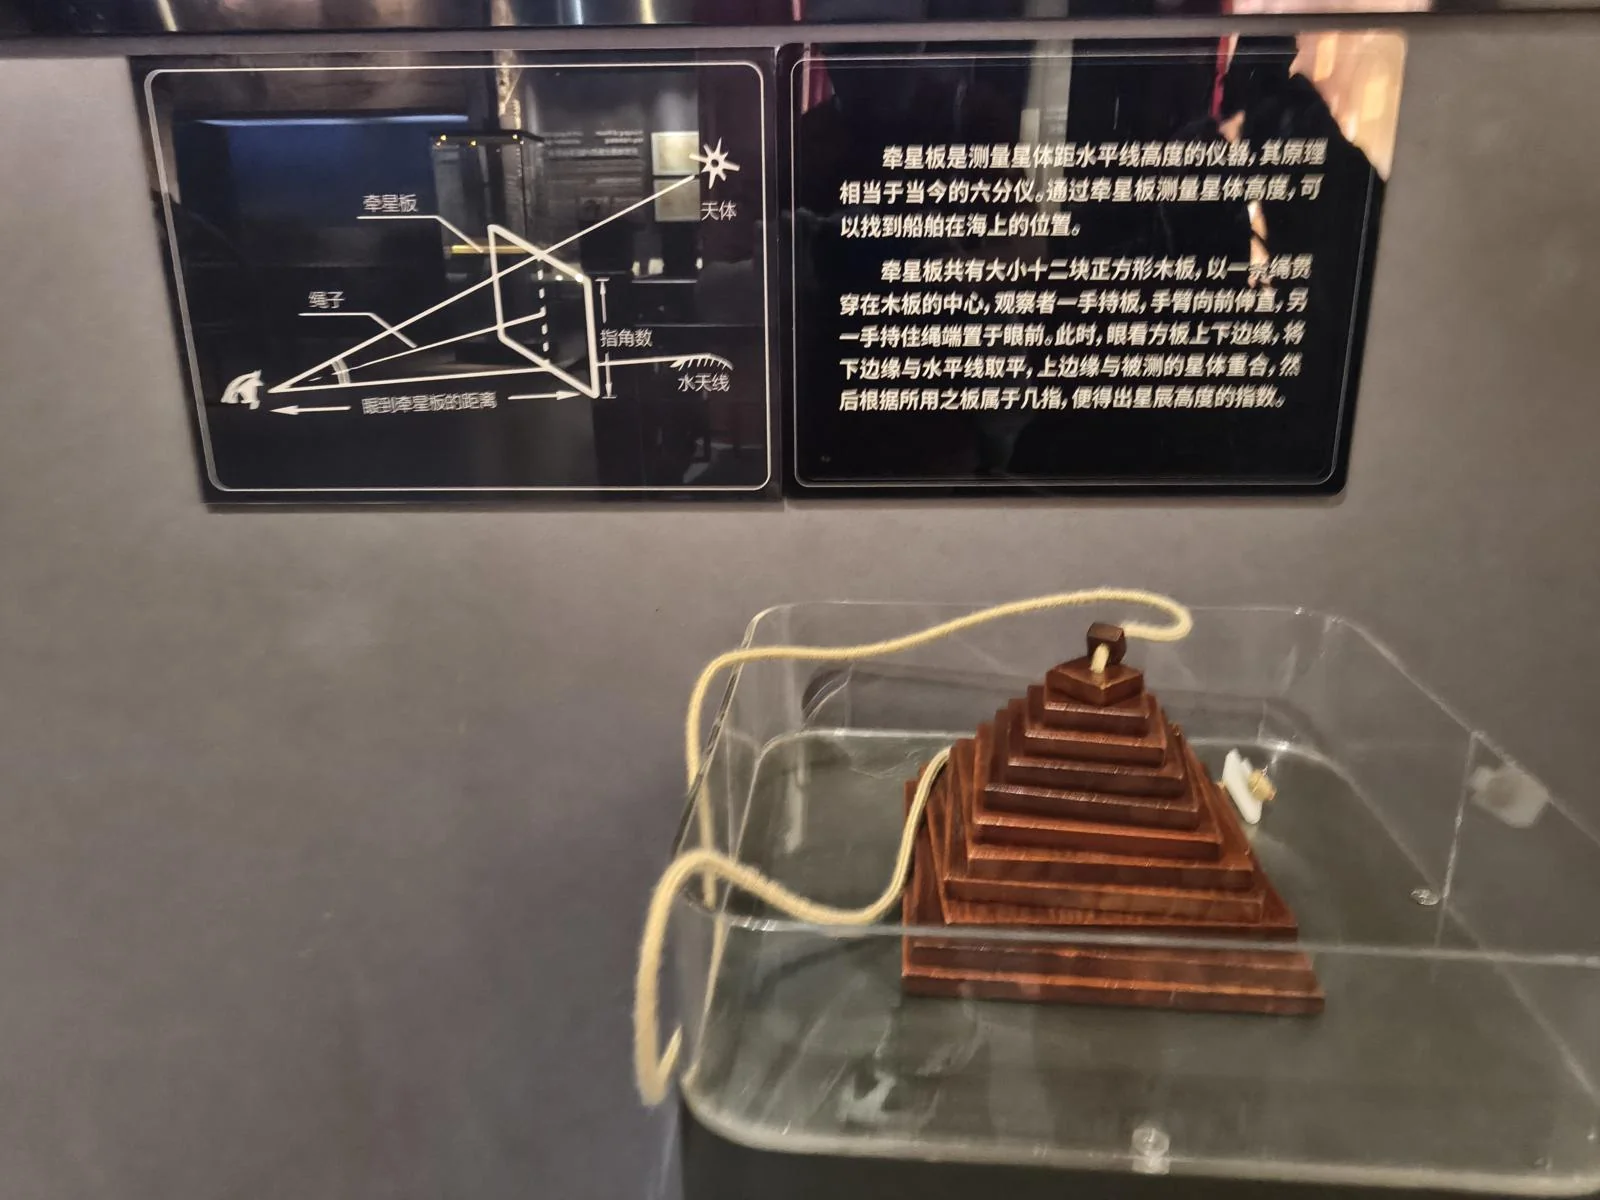
The cross-staff was a tool for measuring a ship’s latitude, usually by sighting the North Star.
It looks complex, but the principle is simple. You select one of the square boards. Holding it at arm’s length, you align its bottom edge with the horizon. If the top edge lines up with the North Star, you’ve found the star’s altitude.
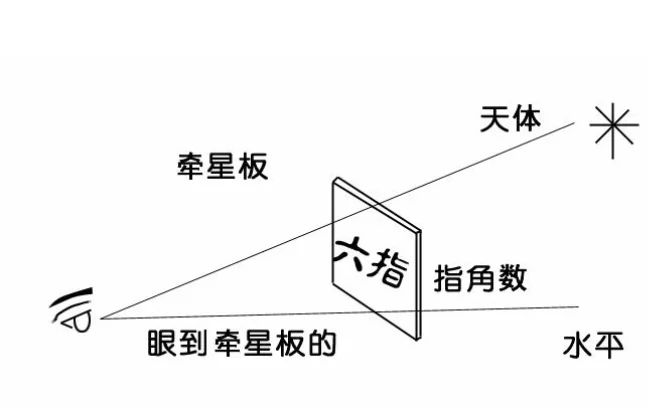
If the “six-finger” board lines up, you’d say, “The North Star is six fingers high.” This measurement could be converted to latitude using a table. A “finger” was a unit of about 2cm. If the alignment wasn’t perfect, you’d try a smaller or larger board.
Amazingly, this crude device played a huge role in Zheng He’s voyages. The method was obviously prone to error—arm lengths differ, and holding the board perfectly vertical on a rocking ship is difficult. But this principle inspired more advanced instruments, like the sextant.
Coincidentally, I found an article from the museum’s official WeChat account that details how to use the cross-staff.
The cross-staff and sextant measure latitude. Longitude was a much harder problem for all ancient seafaring civilizations. But why was knowing only latitude so useful? If you were sailing to a known location, you could look up its latitude, sail north or south until you reached that latitude, and then simply sail east or west along it.
However, I suspect this method would be less effective in archipelagos.
Nationwide Large-Scale Surveys
Rulers throughout history recognized the benefits of accurate measurement and periodically launched nationwide survey campaigns.
Guo Shoujing of the Yuan Dynasty was ordered to conduct a nationwide survey, rivaling Yi Xing’s in scope.
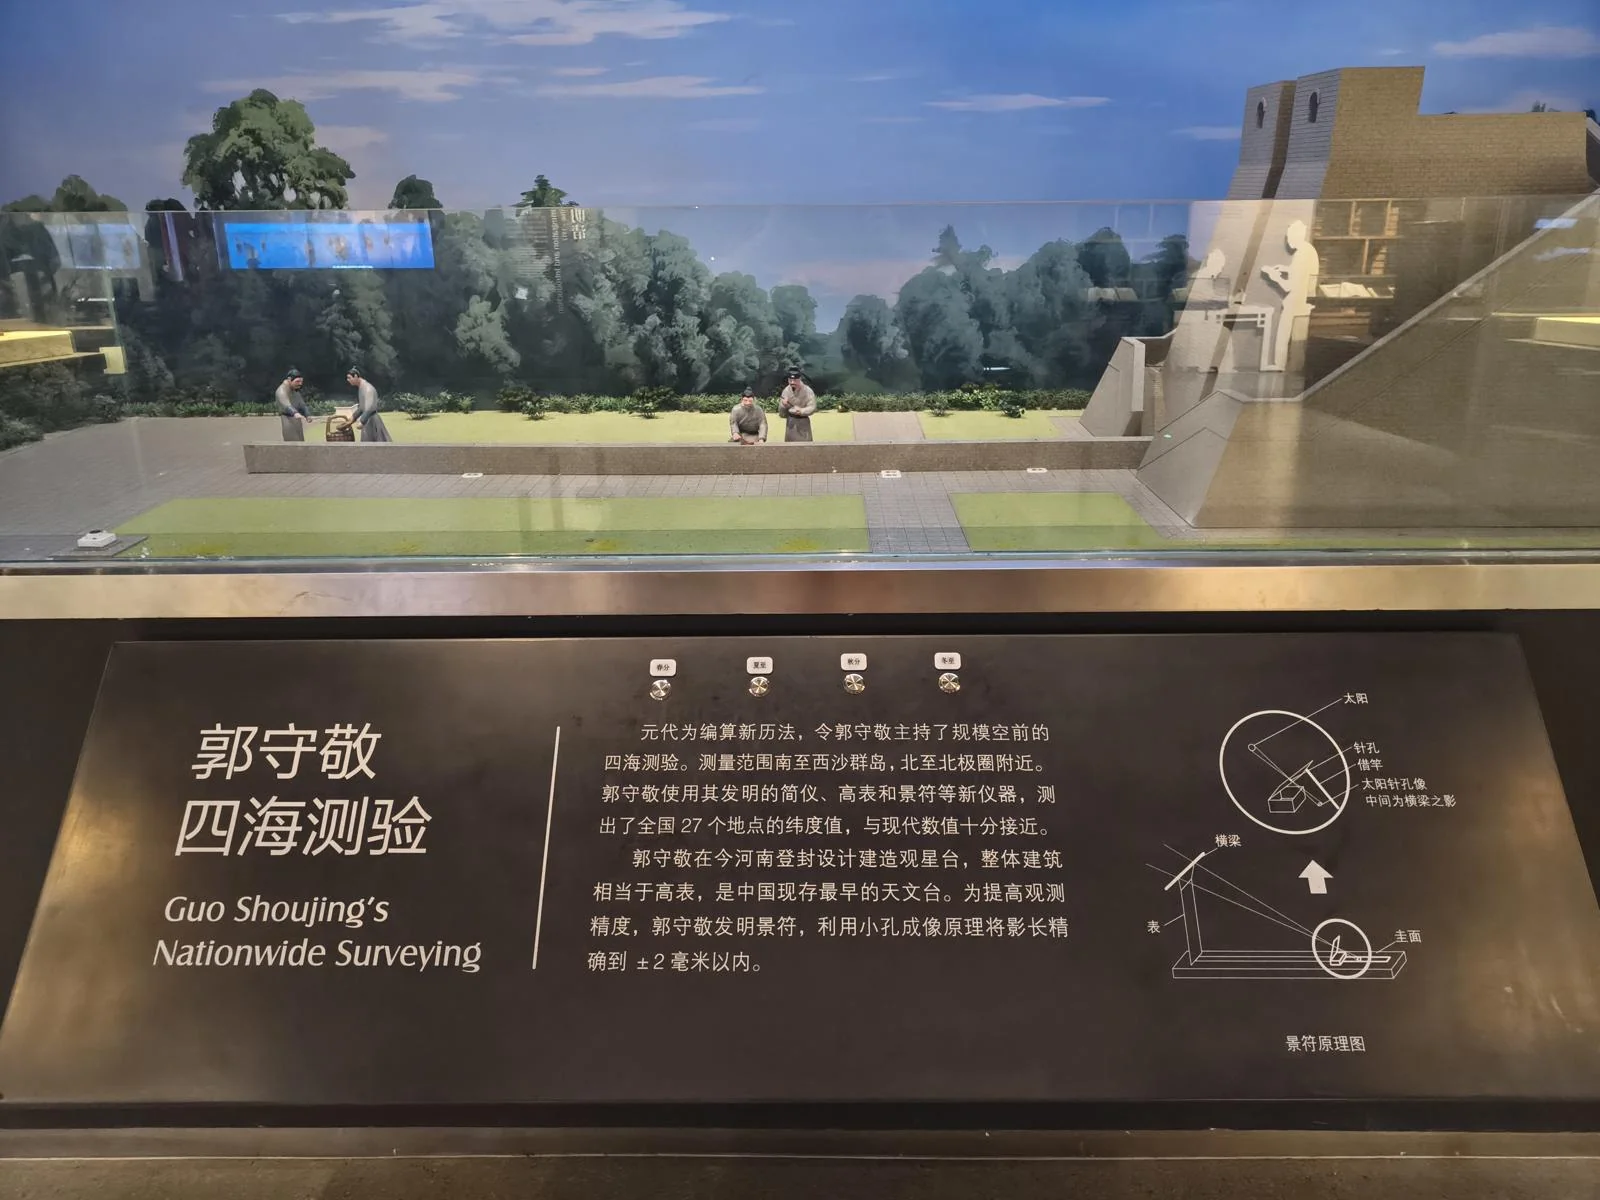
To compile a new calendar, Guo Shoujing led an unprecedented “Four Seas Survey.” It ranged from the Paracel Islands in the south to near the Arctic Circle. Using instruments he invented, like the simplified armillary sphere (Jianyi), he measured the latitudes of 27 locations with accuracy very close to modern values.
In what is now Dengfeng, Henan, Guo Shoujing built an observatory that functioned as a giant gnomon; it’s the oldest surviving observatory in China. To improve accuracy, he invented a “shadow definer” that used a pinhole to measure shadow length to within ±2 millimeters.
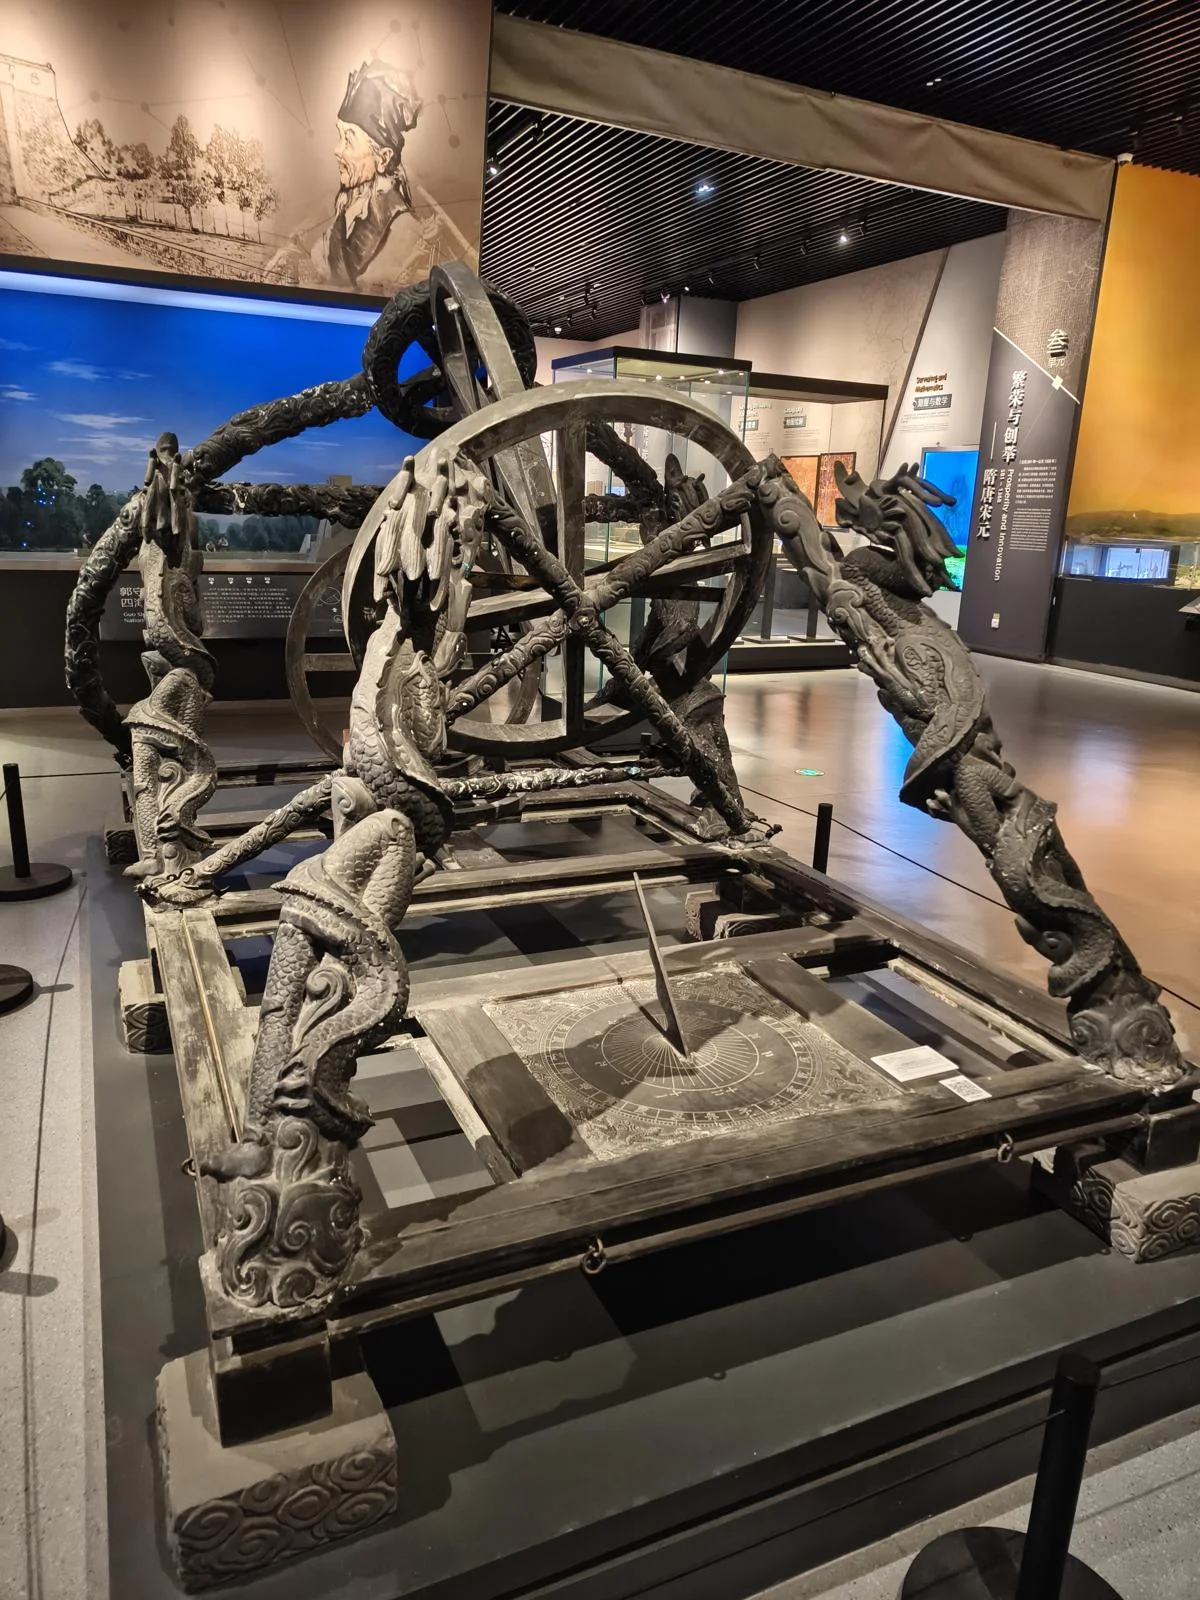
This is the Jianyi, a simplified armillary sphere. It looks anything but simple, but its function was direct: to measure a celestial body’s coordinates.
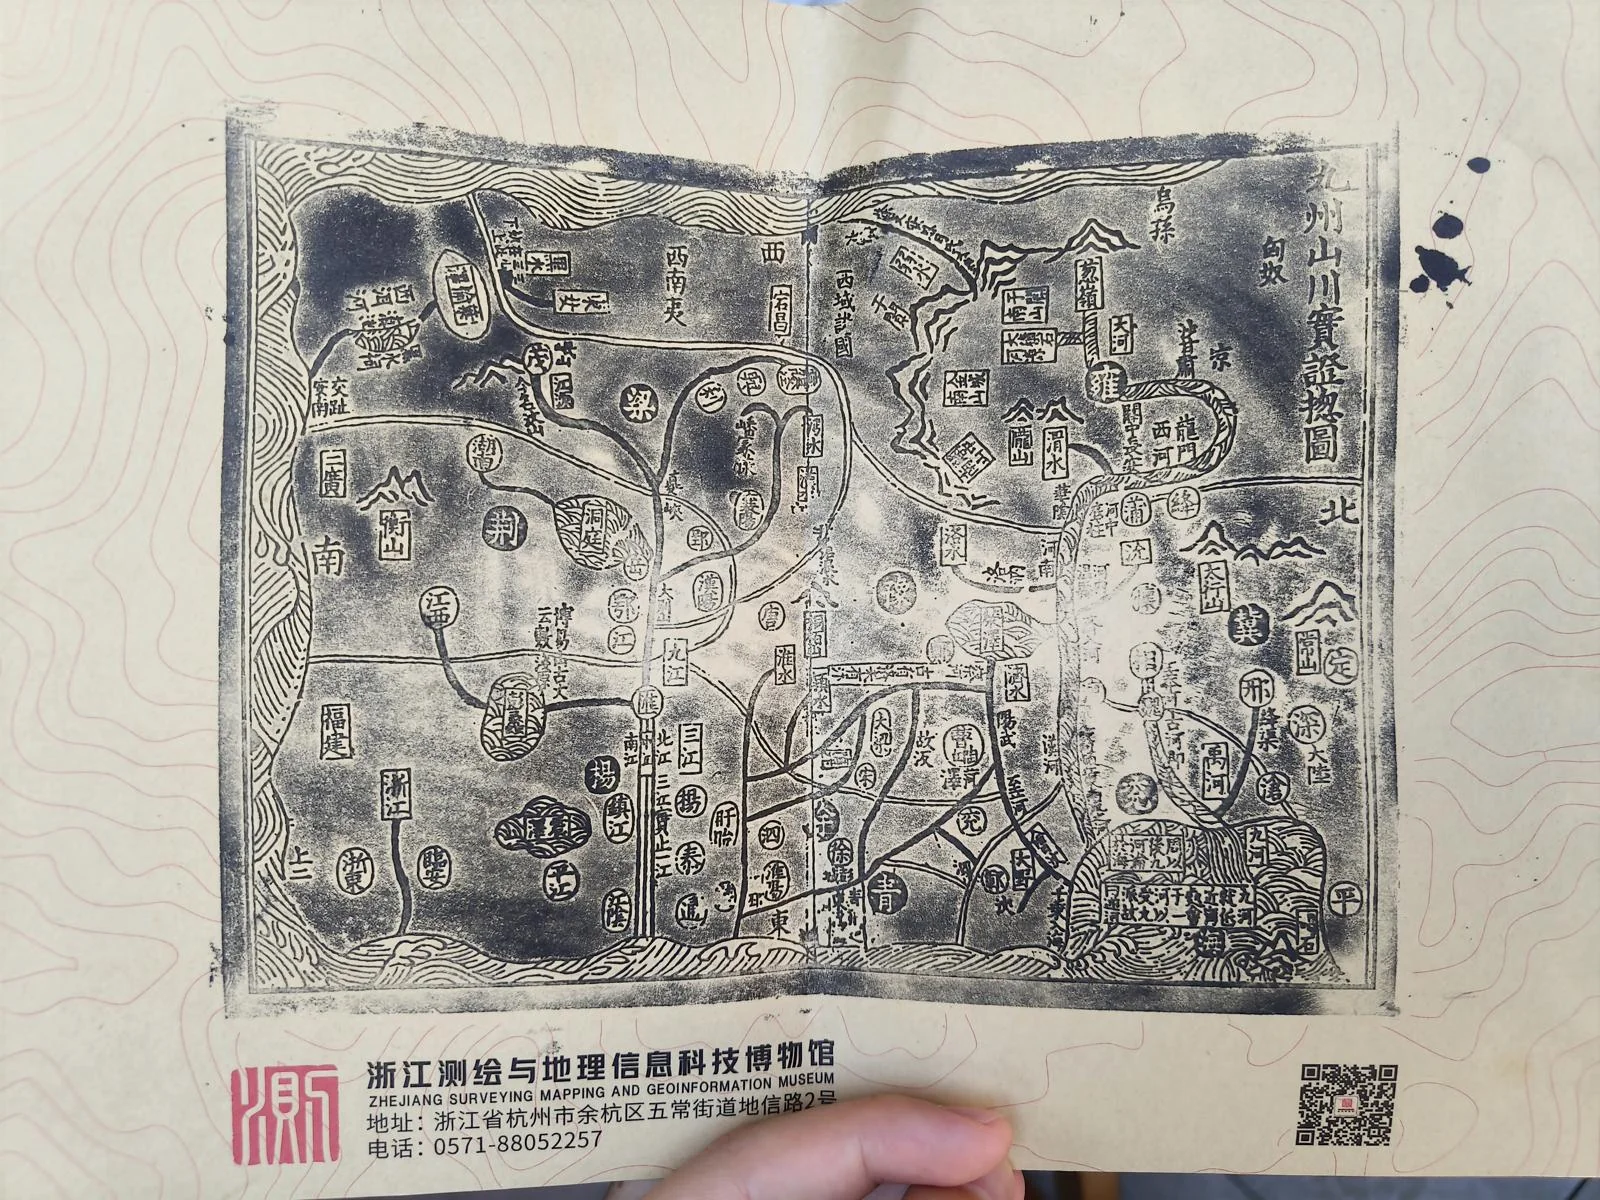
Time was running short, so I didn’t examine the Jianyi closely. I was the only visitor, and a staff member, noticing my interest, told me I could use the paper from the entrance to make a souvenir map rubbing. I chose the “Mountains and Rivers of the Nine Provinces.” Here’s the result:
I asked how large the museum was and realized I’d seen only a fifth of it in half a day. I sped up, stopping only for things that immediately caught my eye and taking photos of the rest.
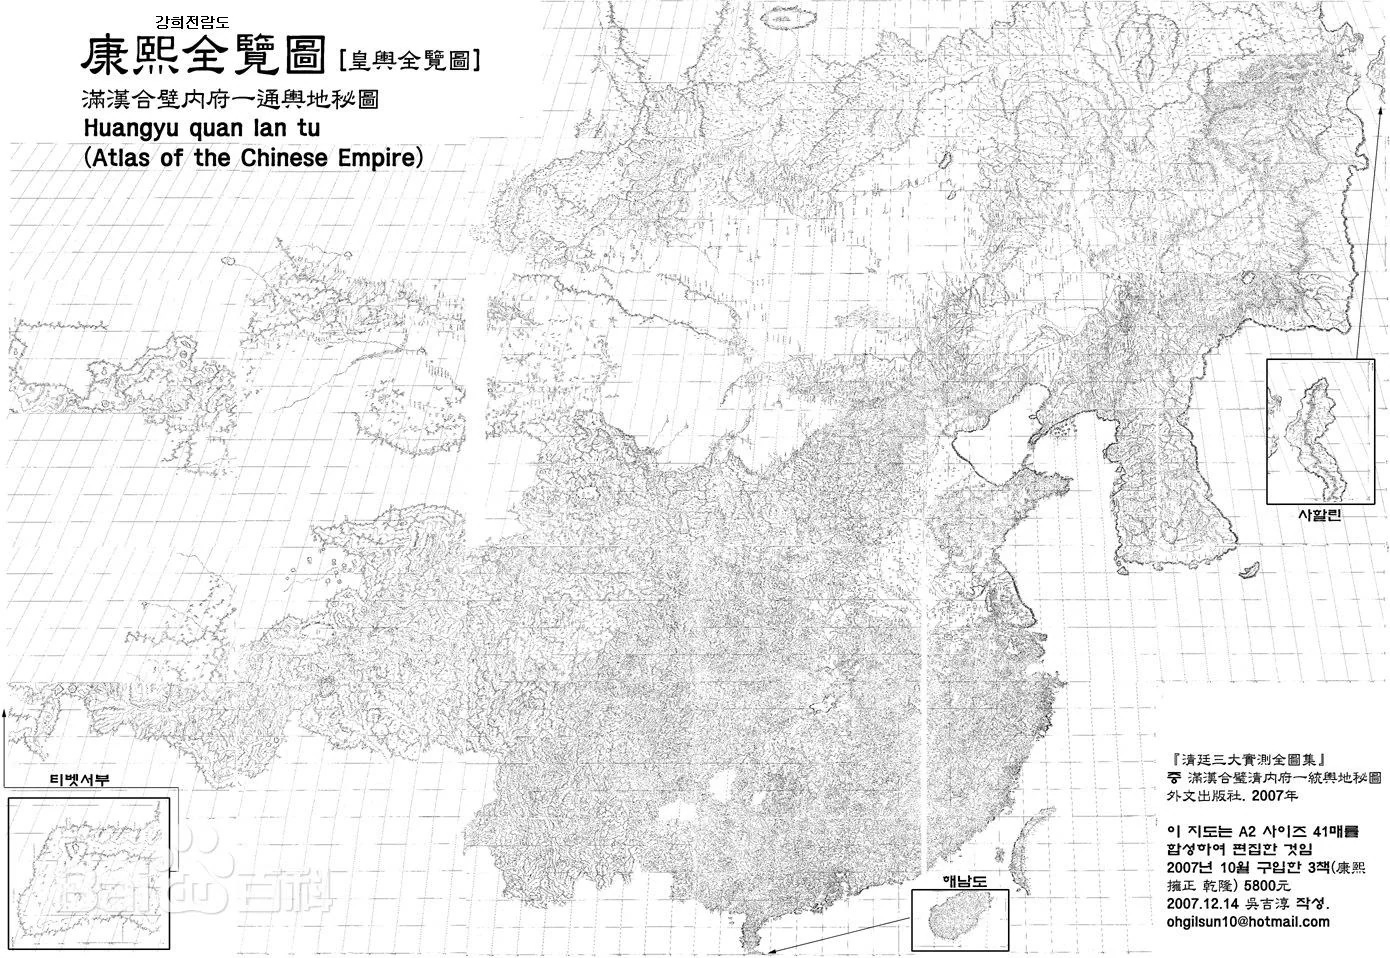
The renowned scholar-emperor Kangxi personally studied and directed a massive survey that produced the Huangyu Quanlan Tu (Map of the Imperial Territories).
Emperor Kangxi of the Qing Dynasty personally directed a large-scale survey using latitude, longitude, and triangulation. It produced 641 coordinate points across the country. Combined with China’s vast geographical literature, this data was used to create the Huangyu Quanlan Tu, China’s first map based on measured coordinates. Its coverage, accuracy, and speed were unparalleled in the world at the time. The project also led to the first survey of Mount Everest and provided the first empirical evidence that the Earth is an oblate spheroid, marking a great leap for Chinese surveying technology.
Regarding the “first discovery that the Earth is an oblate spheroid,” I did some digging. With so much data, they spotted a pattern: the arc length of one degree of latitude was longer at high latitudes than at low latitudes. This meant the Earth is slightly flattened at the poles and bulges at the equator. The difference between Earth’s polar and equatorial diameters is just 0.33%—a tiny discrepancy on a planetary scale, discoverable only through precise measurement. However, “first discovery” should really be “first confirmed,” as Newton had already theorized an oblate spheroid.
But this led me to a contradiction: why does a longer arc length at higher latitudes mean the poles are flatter? My intuition said the opposite.
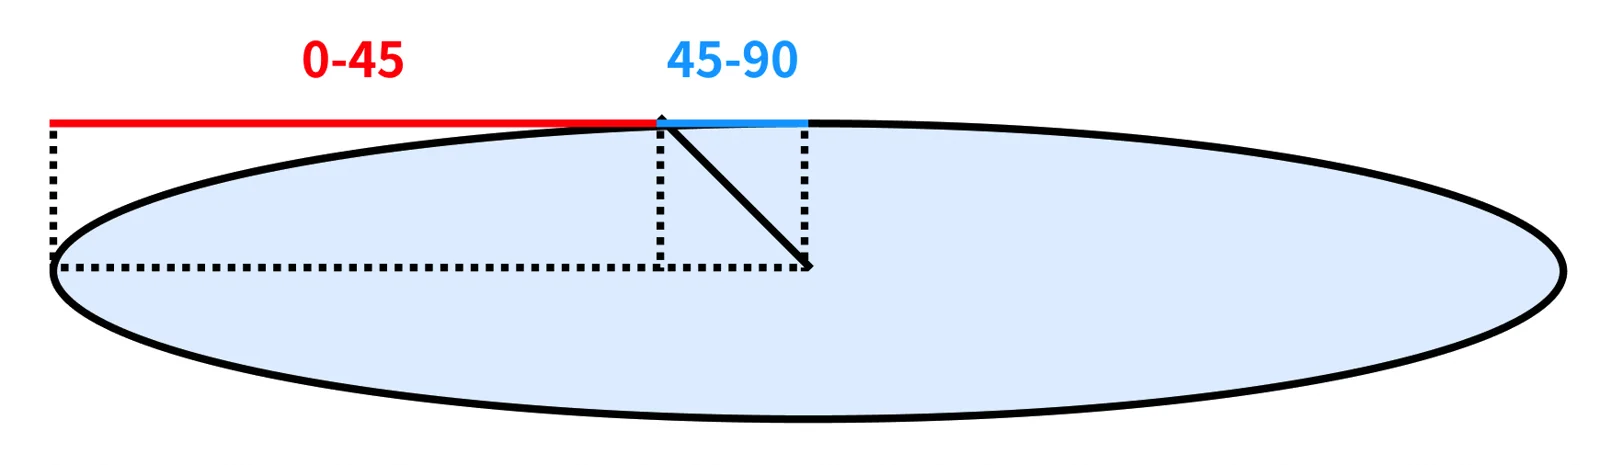
Let’s exaggerate. If the Earth spun much faster, centrifugal force would flatten it like a lens. A cross-section would show that the meridian arc from 0 to 45 degrees is clearly longer than the arc from 45 to 90 degrees.
To avoid being tricked by intuition, I reasoned it out. A quarter meridian can be divided into 90 one-degree arcs. If the high-latitude arcs are longer, then ... < arc 44-45 < arc 45-46 < .... Logically, the total arc length above 45 degrees should be greater than that below it. But my diagram shows the opposite. Where’s the flaw?
After some research, I found the flaw was in my understanding of “latitude.”
We’re used to thinking of Earth as a perfect sphere where latitude lines are evenly spaced. On a perfect sphere, definitions of latitude don’t matter. But on an oblate spheroid, the two common definitions differ:
- Geodetic Latitude: The angle between the normal (a line perpendicular to the surface) and the equatorial plane. This line does not necessarily pass through the Earth’s center.
- Geocentric Latitude: The angle between a line from the surface to the Earth’s center and the equatorial plane.
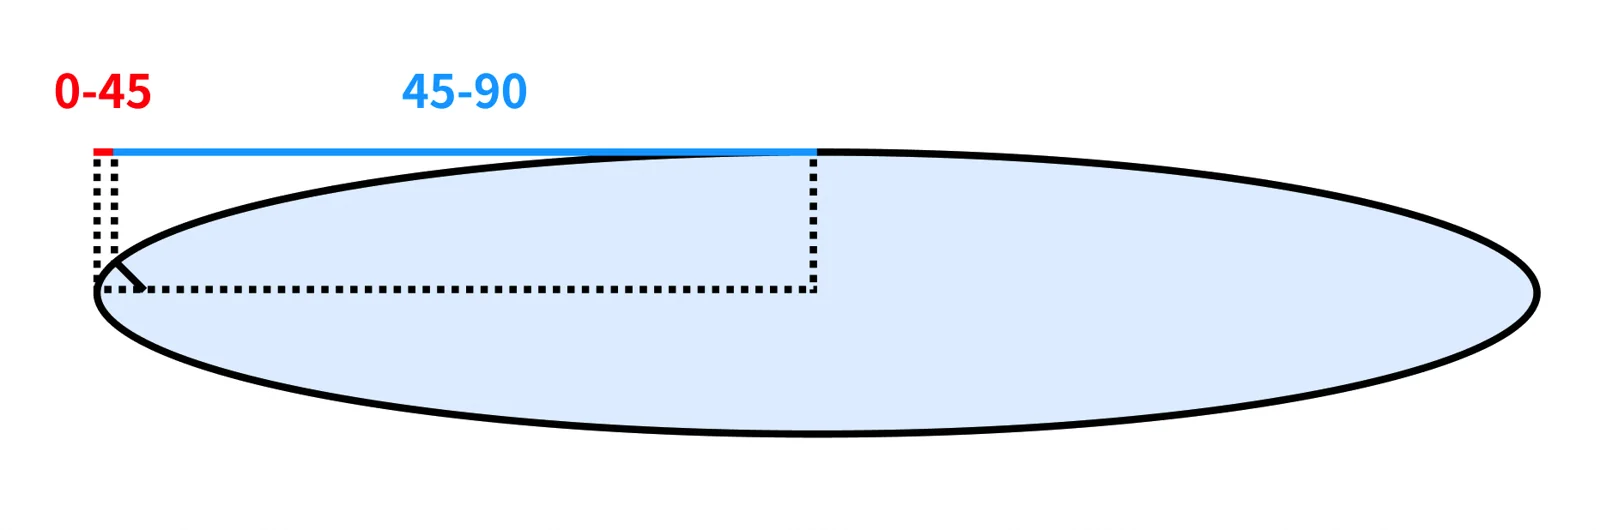
As the diagram shows, 45 degrees geodetic latitude is not where you’d intuitively think it is. Conflict resolved.
My mistake was assuming geocentric latitude, a classic case of modern knowledge leading to a wrong assumption. Geographical latitude is geodetic. From an ancient perspective, geodetic latitude is far more intuitive and measurable—you don’t even need to believe the Earth is a sphere to use it. The concept of geocentric latitude, on the other hand, is meaningless without a spherical Earth model.
Enough about latitude. Back to the Huangyu Quanlan Tu. The museum had a QR code for an audio guide, which I’ve transcribed:
http://ws.taoart.com/bwgAudio/audio/detail.htm?id=1223
There were also several other ancient surveying instruments on display:
Kangxi Era Globe (Replica)
http://ws.taoart.com/bwgAudio/audio/detail.htm?id=1224
A globe offers a visual overview of the Earth. This one was made by the Imperial Household Department workshop, based on the Kunyu Tushuo (Illustrated Account of the Earth) by Ferdinand Verbiest, a Belgian missionary and Emperor Kangxi’s science tutor. The theory of a round Earth is the basis for latitude and longitude measurement and map projection.
Gilt Copper Orrery of the Seven Luminaries (Replica)
http://ws.taoart.com/bwgAudio/audio/detail.htm?id=1225
Used to demonstrate the movements of the seven luminaries (Venus, Jupiter, Mercury, Mars, Saturn, the Sun, and the Moon) and celestial events like eclipses. Longitude for the Huangyu Quanlan Tu was measured primarily by observing lunar eclipses and the occultations of Jupiter’s moons.
Imperial Gilt Copper Astrolabe (Replica)
http://ws.taoart.com/bwgAudio/audio/detail.htm?id=1226
Used to calculate time for geodetic surveys. It consists of a base plate, a celestial plate, a triangular gnomon, and a plumb line. The celestial plate is rotated to align the gnomon with key stars, and the time is read from the corresponding solar term on the base plate.
Theodolite with a Single Telescope (Replica)
http://ws.taoart.com/bwgAudio/audio/detail.htm?id=1227
Used to measure azimuth angles. The disk is engraved from 10° to 360° and has four sight vanes. Two are fixed, and two are movable, supporting a telescope with a spirit level for horizontal correction.
Copper Altitude Quadrant (Replica)
http://ws.taoart.com/bwgAudio/audio/detail.htm?id=1228
Used to measure the altitude of a celestial body or an object above the horizon, and also for horizontal angles. The base has an embedded compass to correct the measurement direction.
Plane Table (Replica)
http://ws.taoart.com/bwgAudio/audio/detail.htm?id=1229
Used to measure distances and survey plots of land. One side has fixed sight vanes, and a movable alidade is in the lower-left. Drawing paper is clipped to the board, allowing for simultaneous surveying and drawing.
Black Lacquer Box of Drawing Instruments (Replica)
http://ws.taoart.com/bwgAudio/audio/detail.htm?id=1230
This two-layered box contains over thirty drawing instruments, including various dividers, compasses, scales, rulers, and a protractor.
Modern and Contemporary Chinese Surveying and Mapping
After the ancient section, I skipped a small exhibit on modern history and went straight to the contemporary surveying area.
Surveying Datums
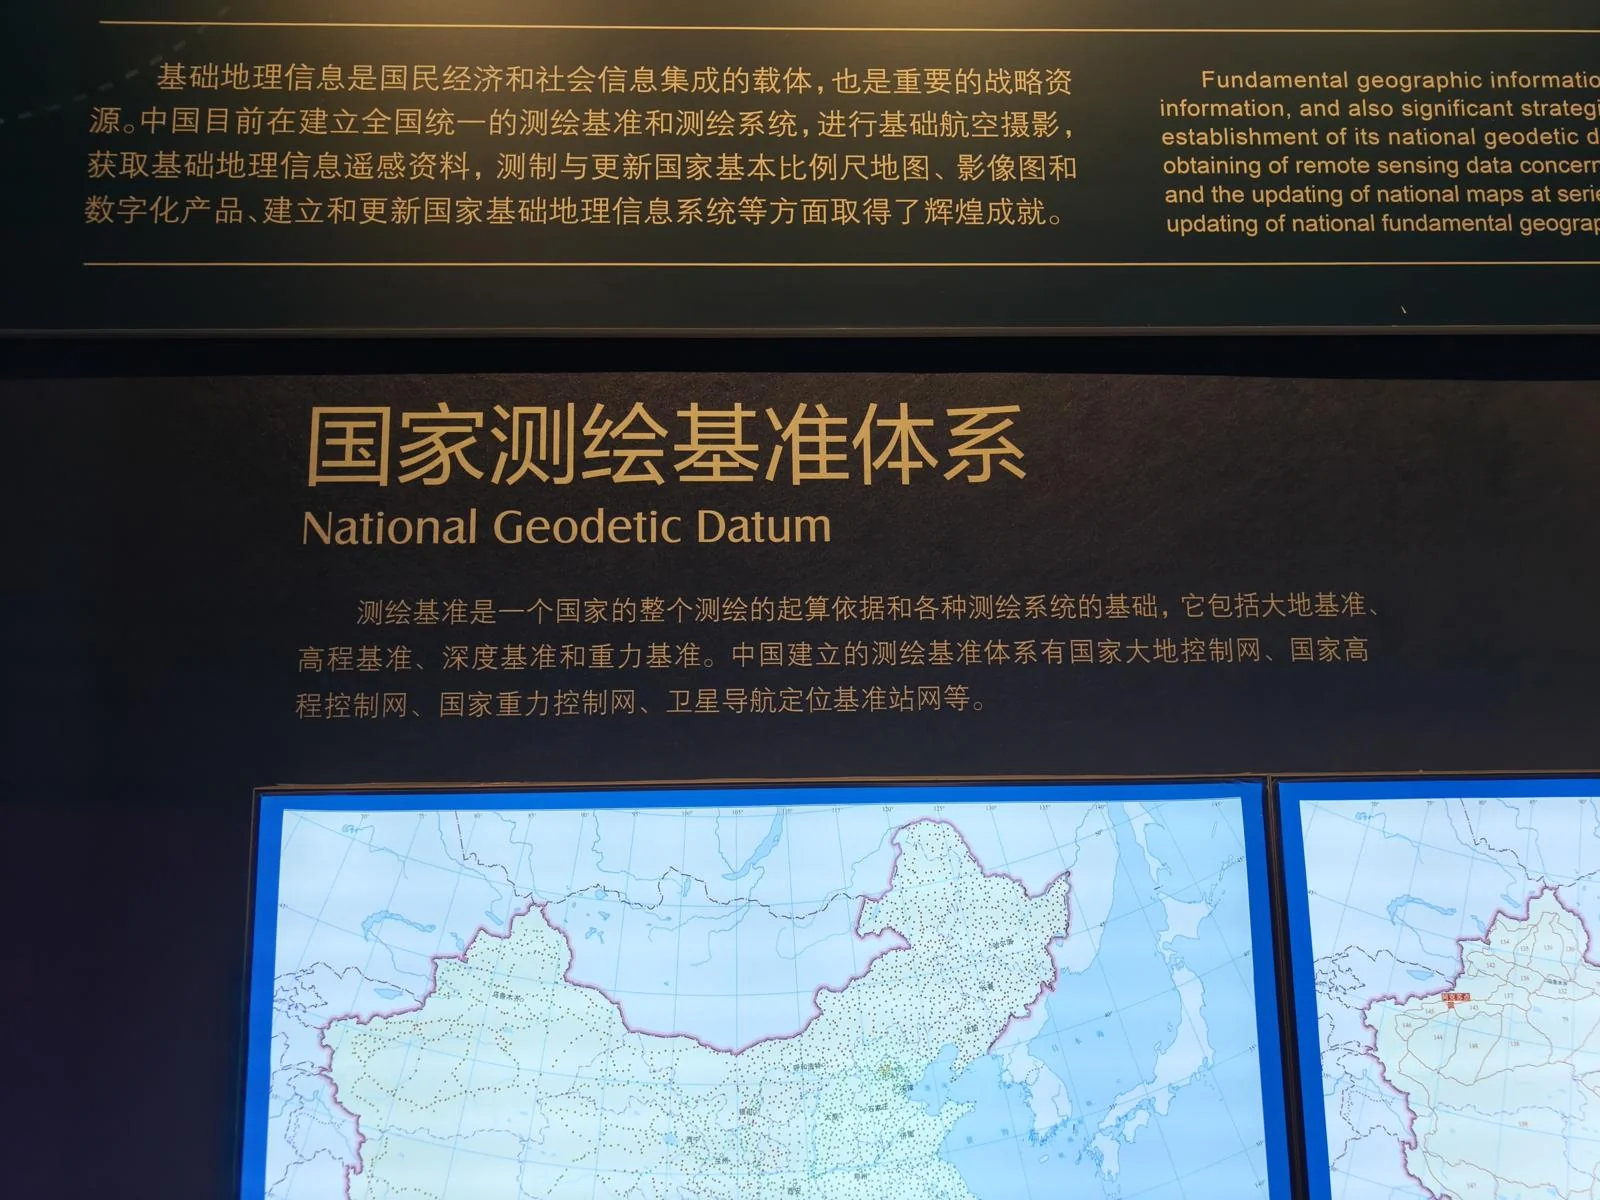
First up: national surveying datums. In plain English: what do we measure, and by what standards?
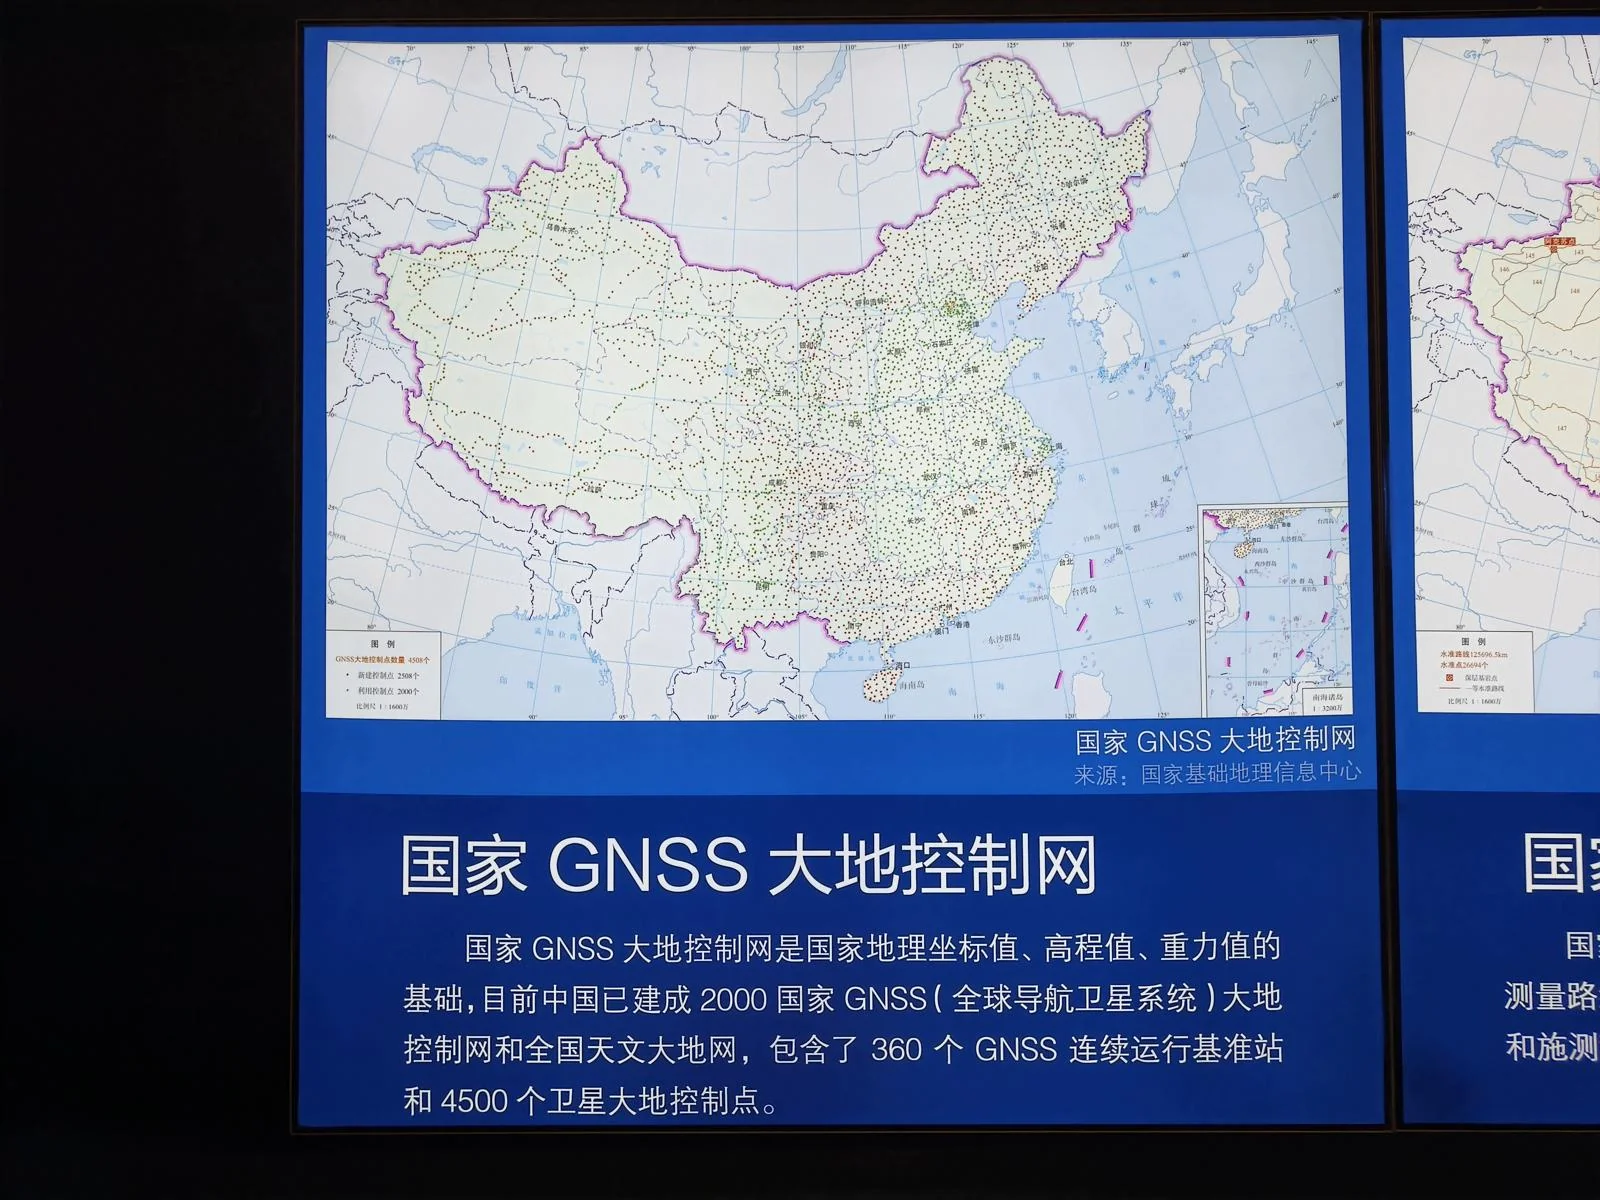
The geodetic control network defines 3D coordinates. Ground survey reference stations are scattered across the country. Like the international prototype meter and kilogram, their coordinates are maintained with extreme precision, and all other locations are calculated relative to them.
This involves ground stations, real-time satellite monitoring, and data centers. Even minute factors like tectonic plate movement are tracked, allowing the system to dynamically update the true coordinates of each station.
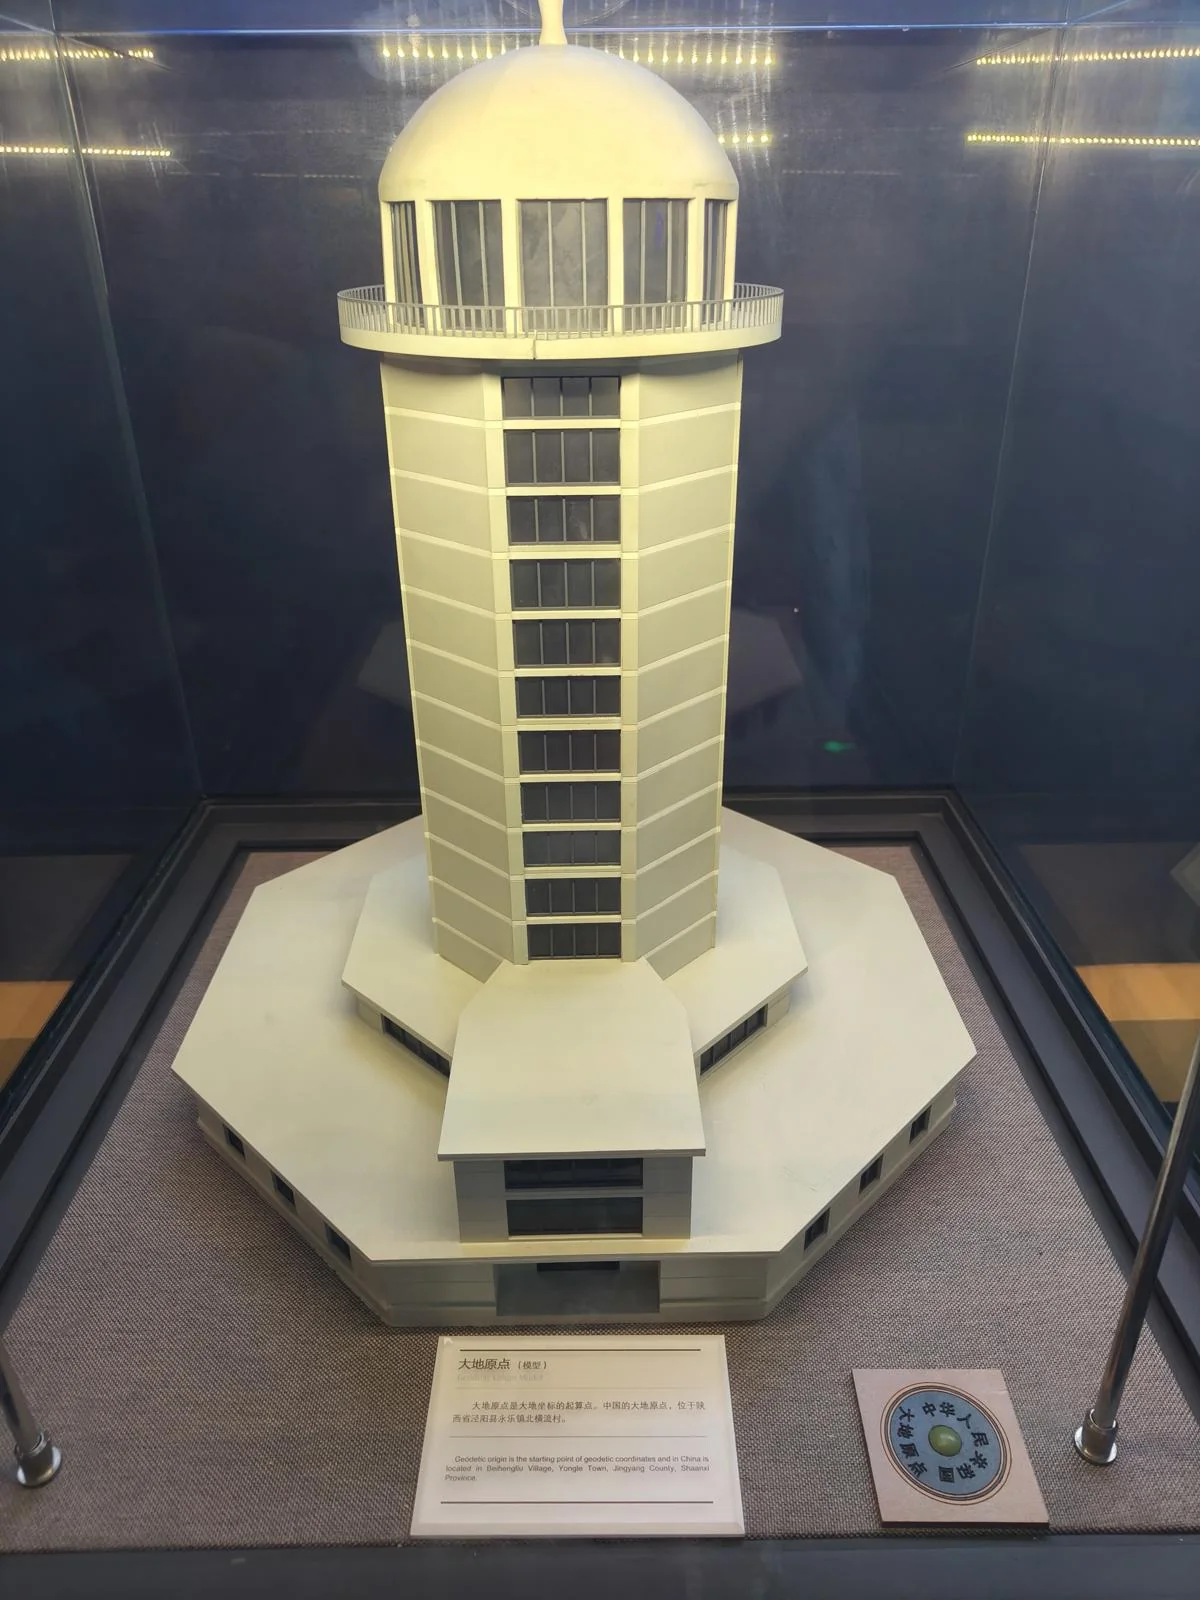
A model of a classic geodetic origin. China’s geodetic origin is in Jingyang County, Shaanxi Province. It was chosen in the last century because it was near the country’s geographical center and geologically stable. This facilitated the expansion of the control network nationwide.
Today, however, the network no longer uses a physical origin. With modern technology, the geodetic origin is defined as the Earth’s center of mass, in line with international standards.
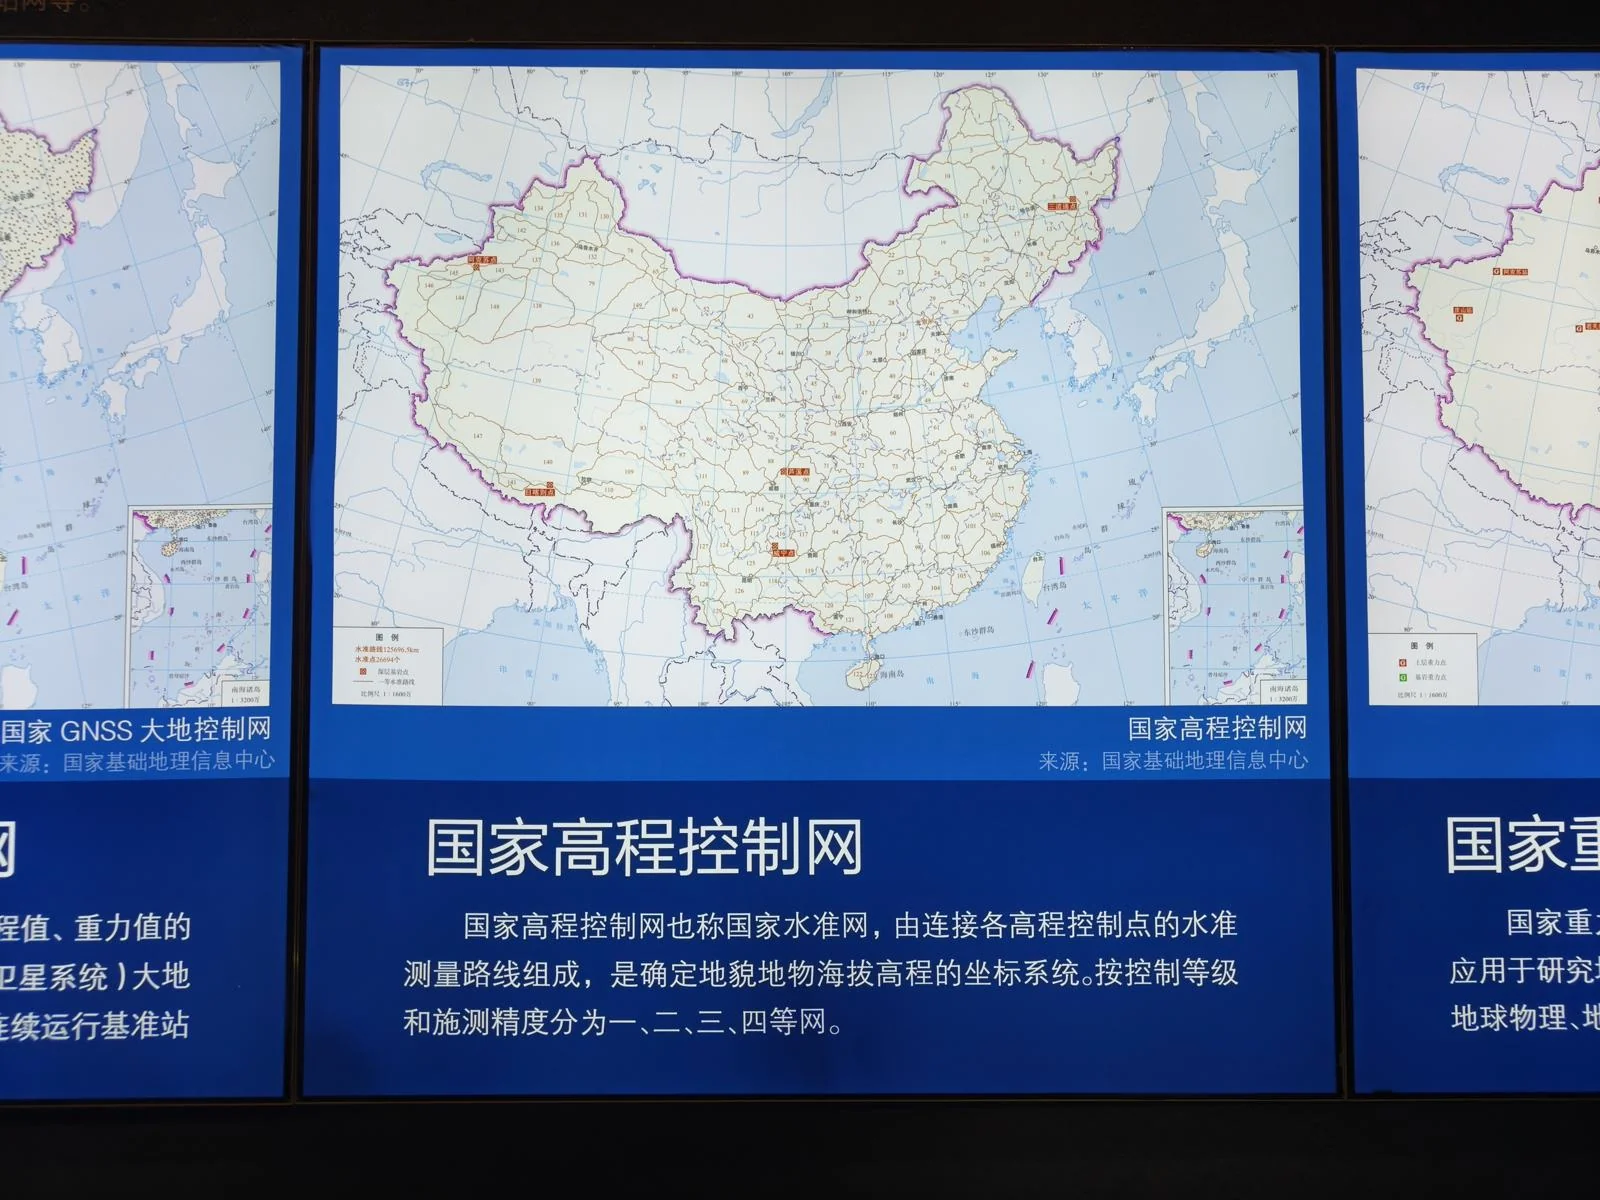
The vertical control network is similar, defining numerous reference points for altitude.
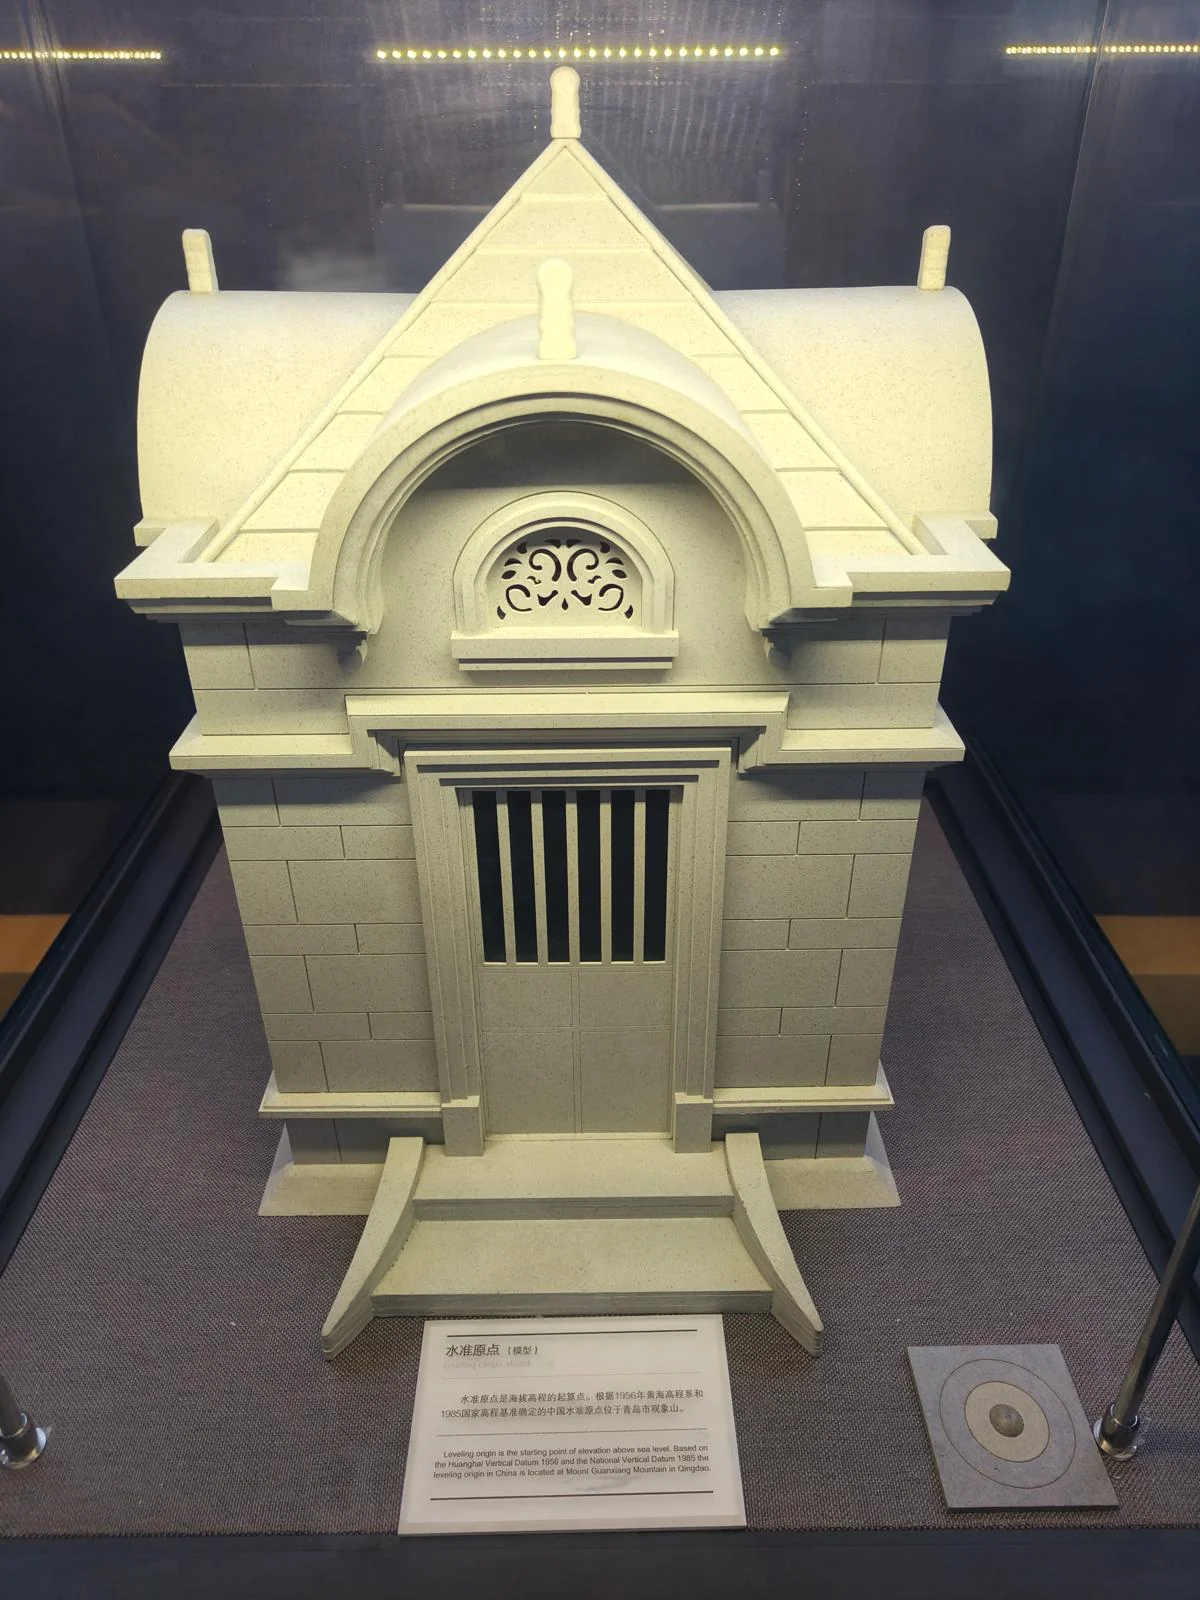
This is a model of a leveling benchmark, the starting point for altitude measurements, located on Guanxiang Hill in Qingdao.
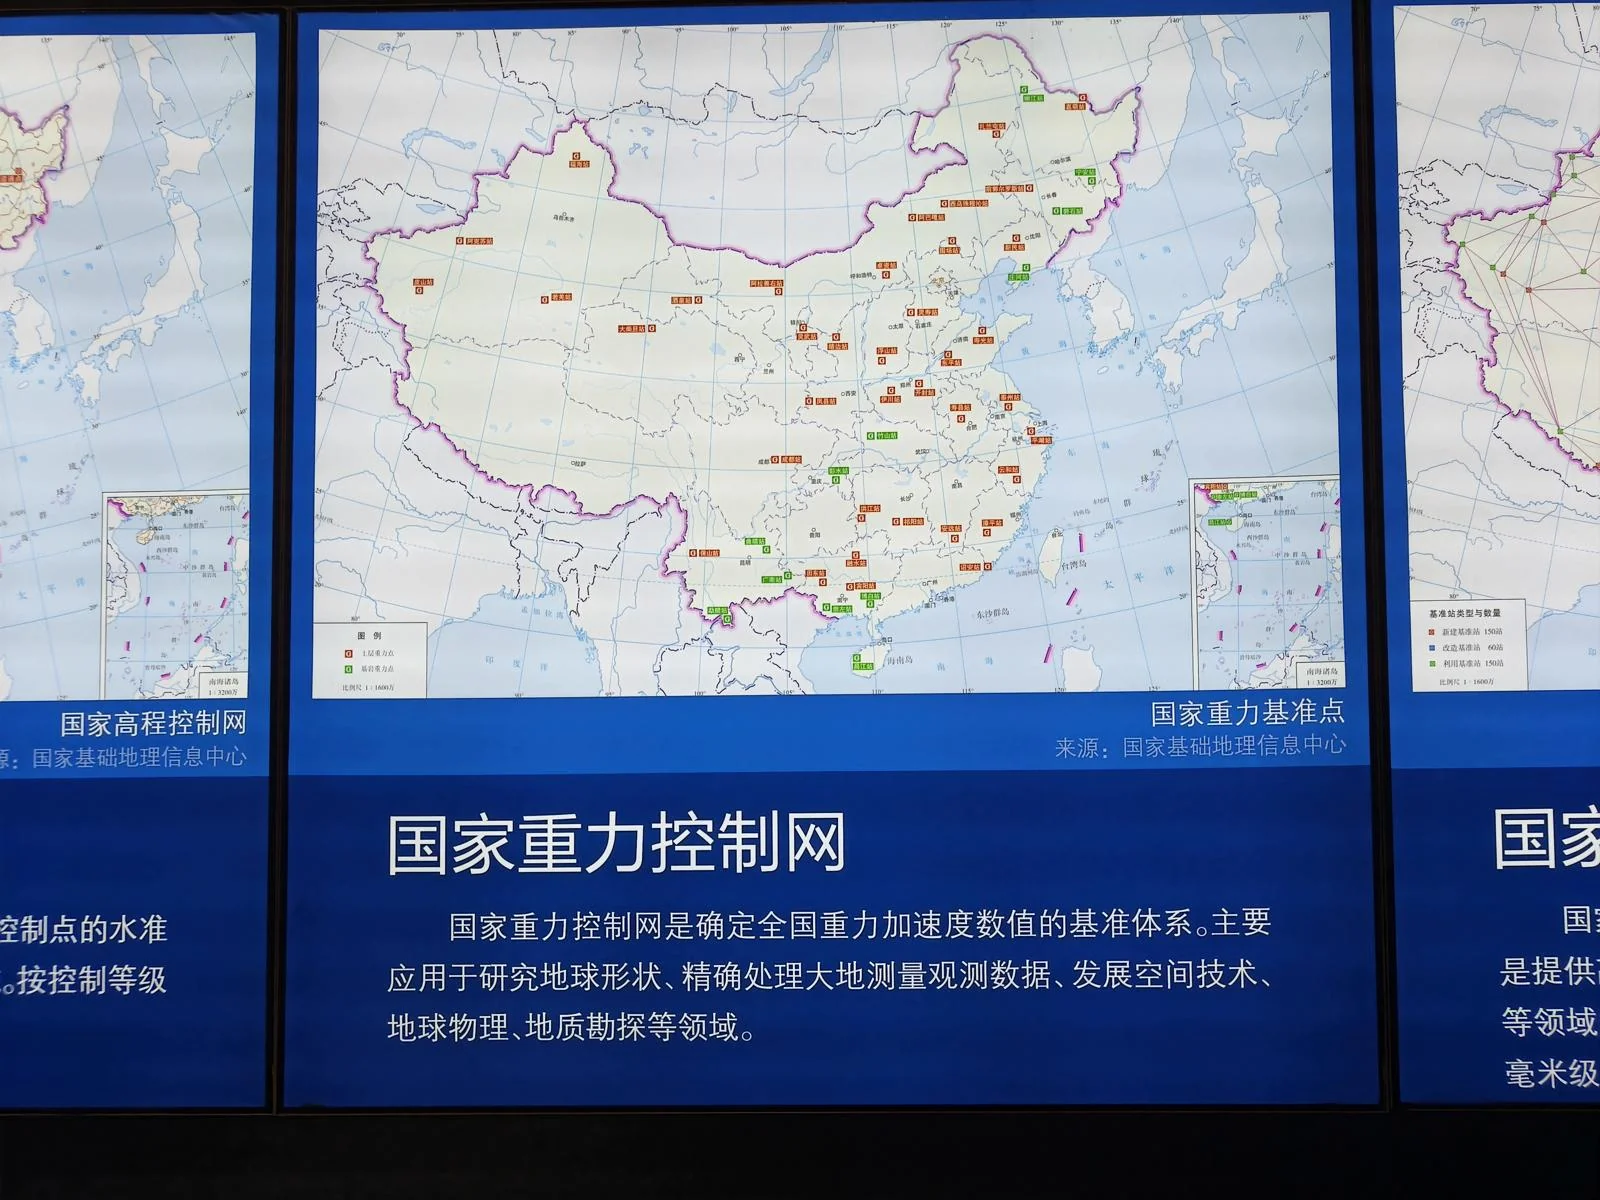
There are also reference points for gravity.
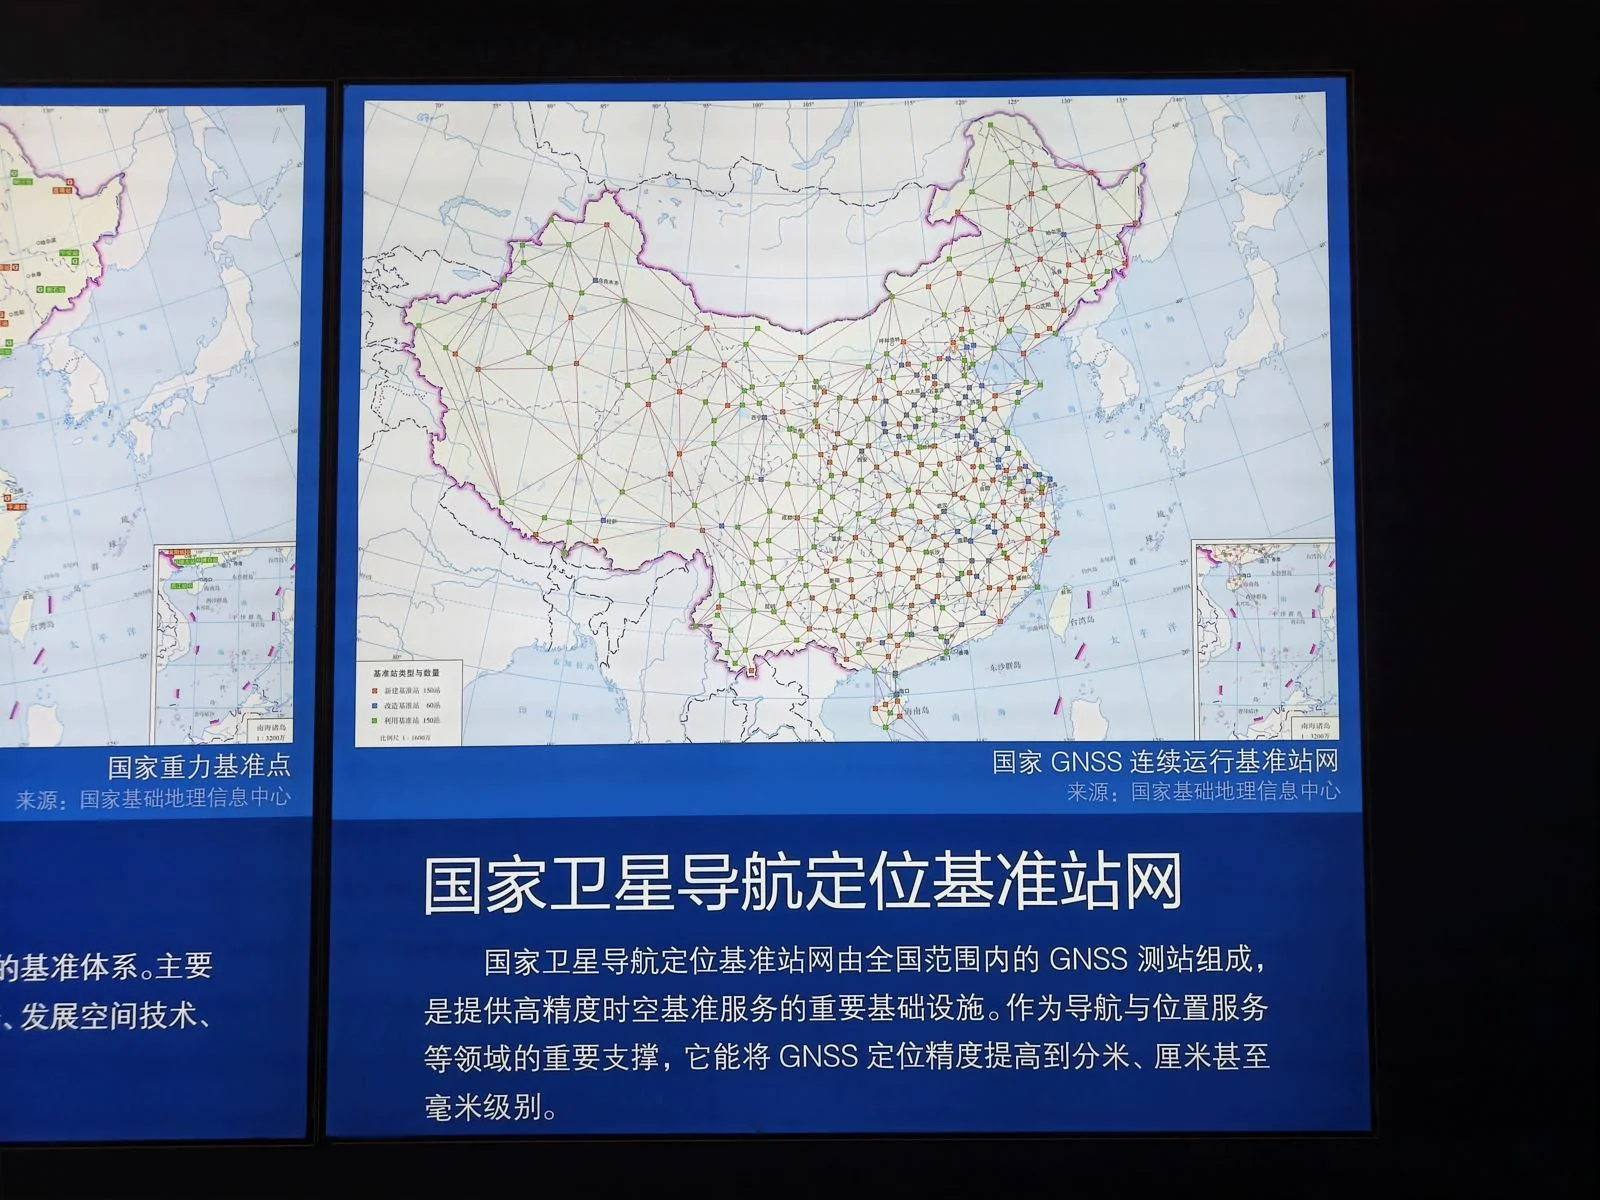
And a network of reference stations for satellite navigation and positioning.
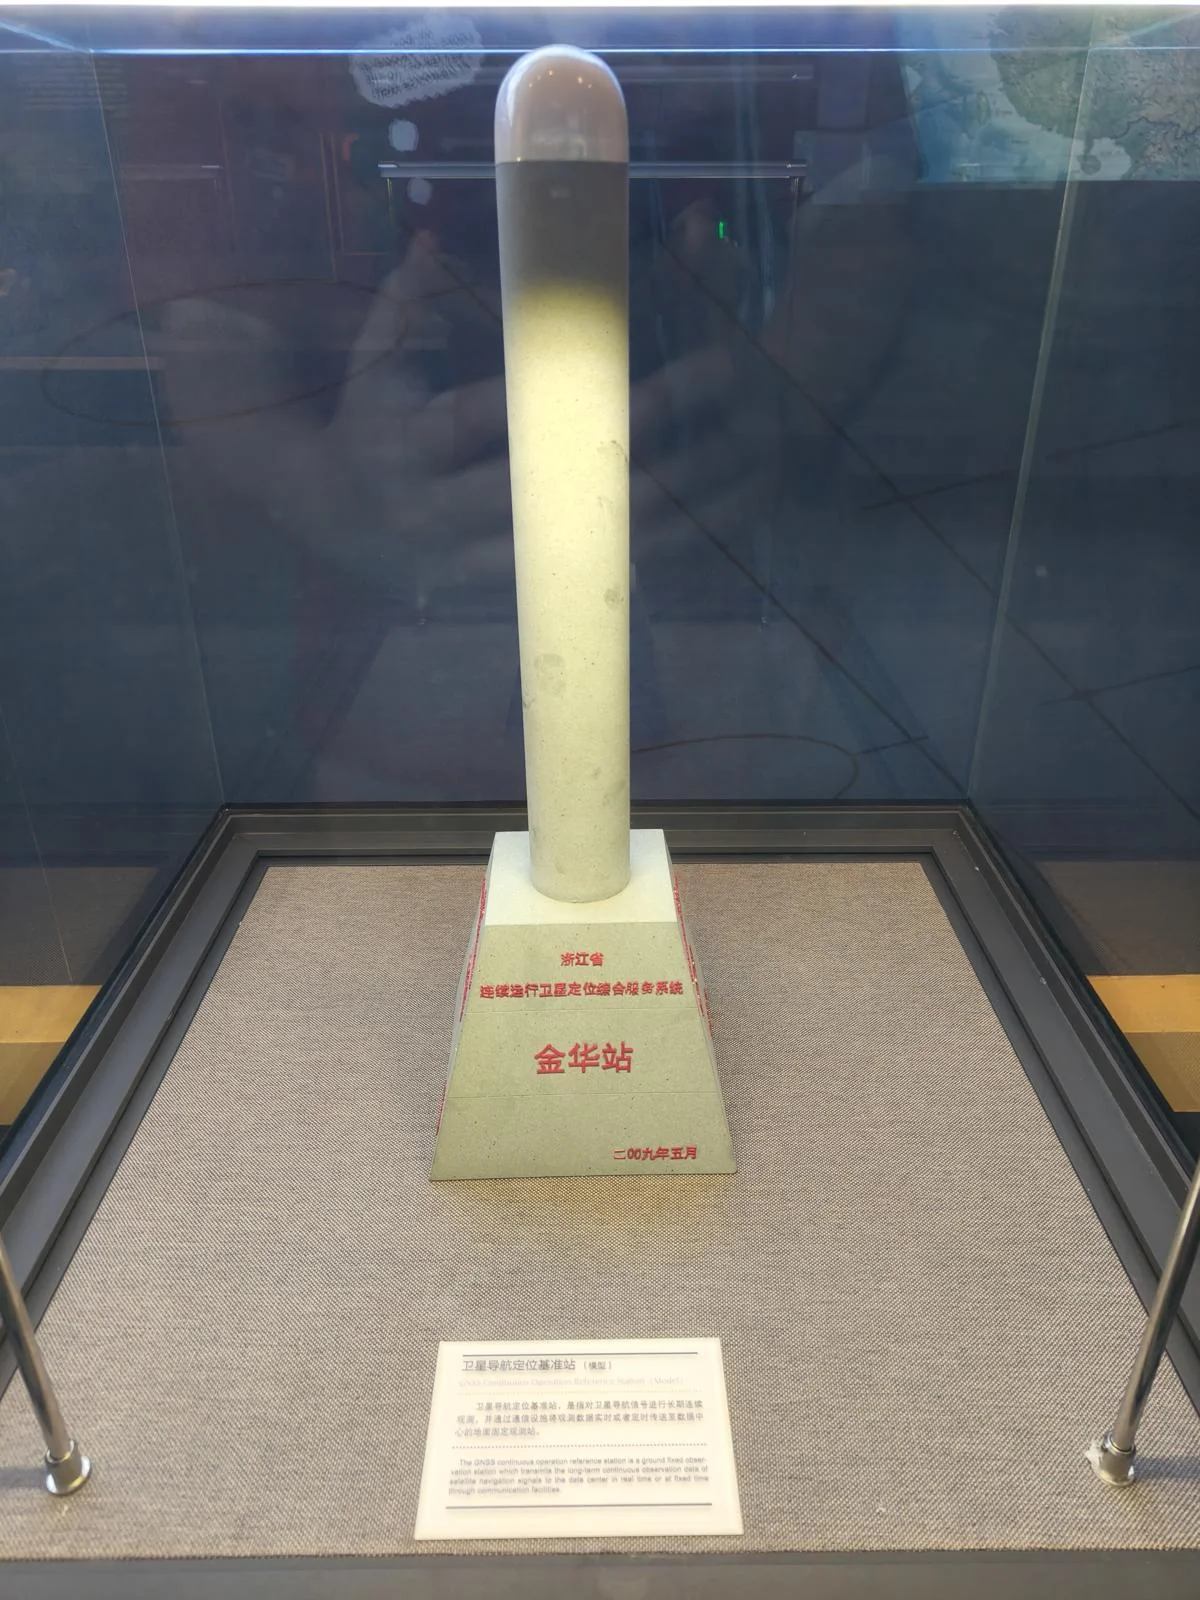
A satellite navigation and positioning reference station.
Applications of Datums
What can we do with these datums?
With accurate 3D coordinates, we can perform precise nationwide analysis for the first time.
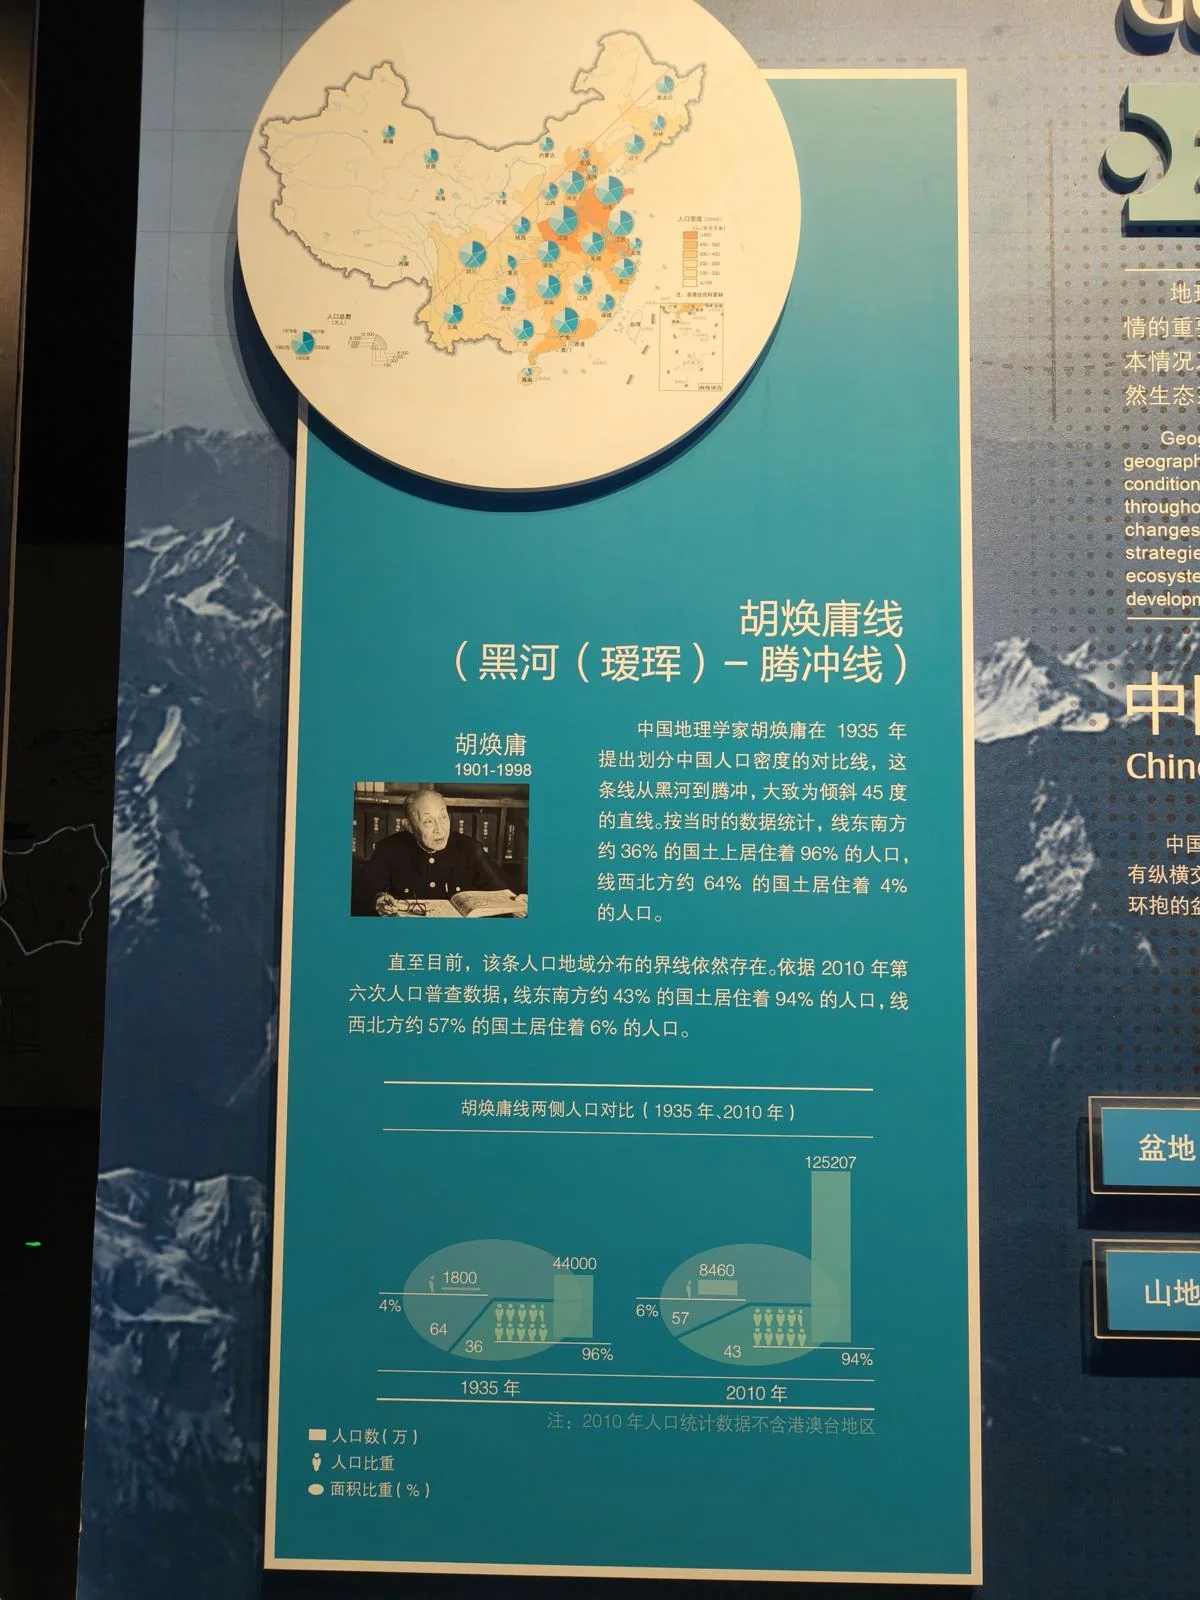
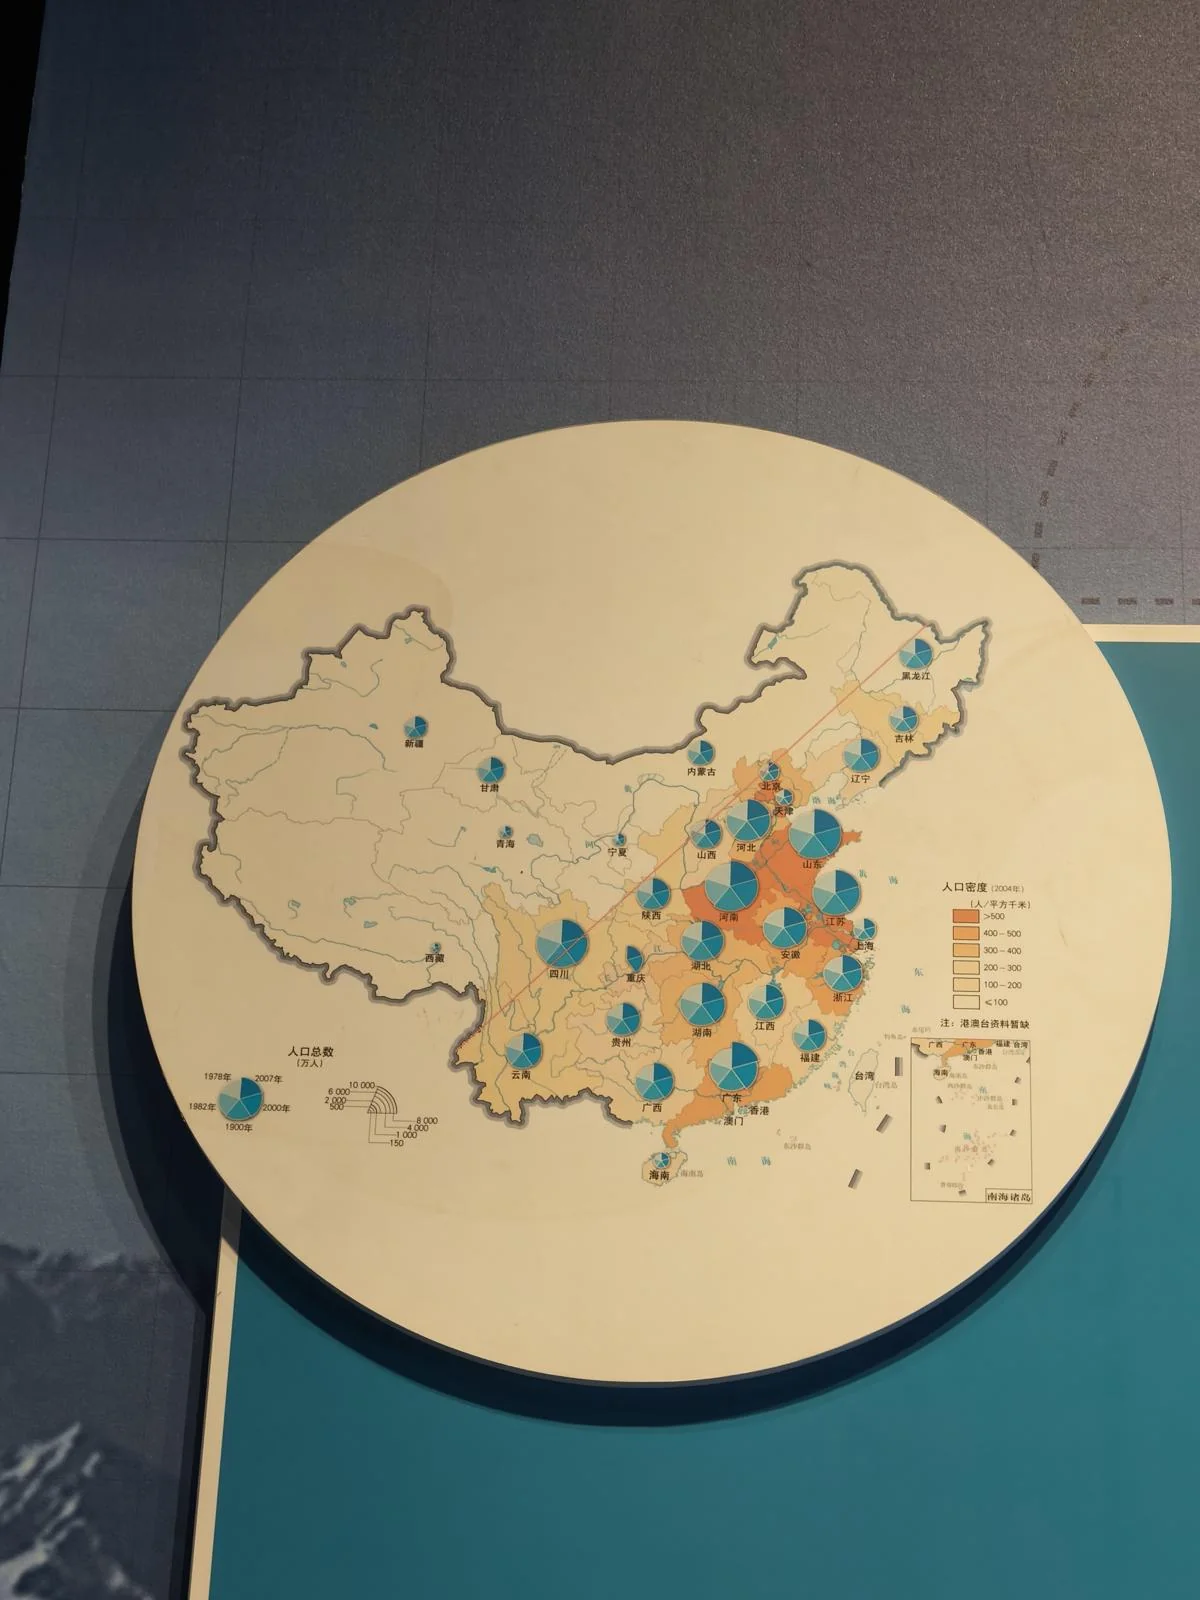
The Hu Huanyong Line diagonally divides China. A comparison of the two sides reveals a stark population imbalance:
In 1935, geographer Hu Huanyong proposed a line dividing China’s population density. It runs from Heihe to Tengchong. At the time, 96% of the population lived on 36% of the land southeast of the line, while 4% lived on the other 64%.
This demographic divide persists. According to the 2010 census, 94% of the population lives on 43% of the land southeast of the line, with 6% on the remaining 57%.
Hu didn’t just draw an arbitrary line. It’s a real geographical boundary where population density drops off sharply, and it has been stable for a long time. It reflects China’s geographical realities and closely matches the 400mm annual precipitation line. Monsoons, water resources, terrain, and history have all contributed to the distinctly different civilizations on either side: agricultural and pastoral.
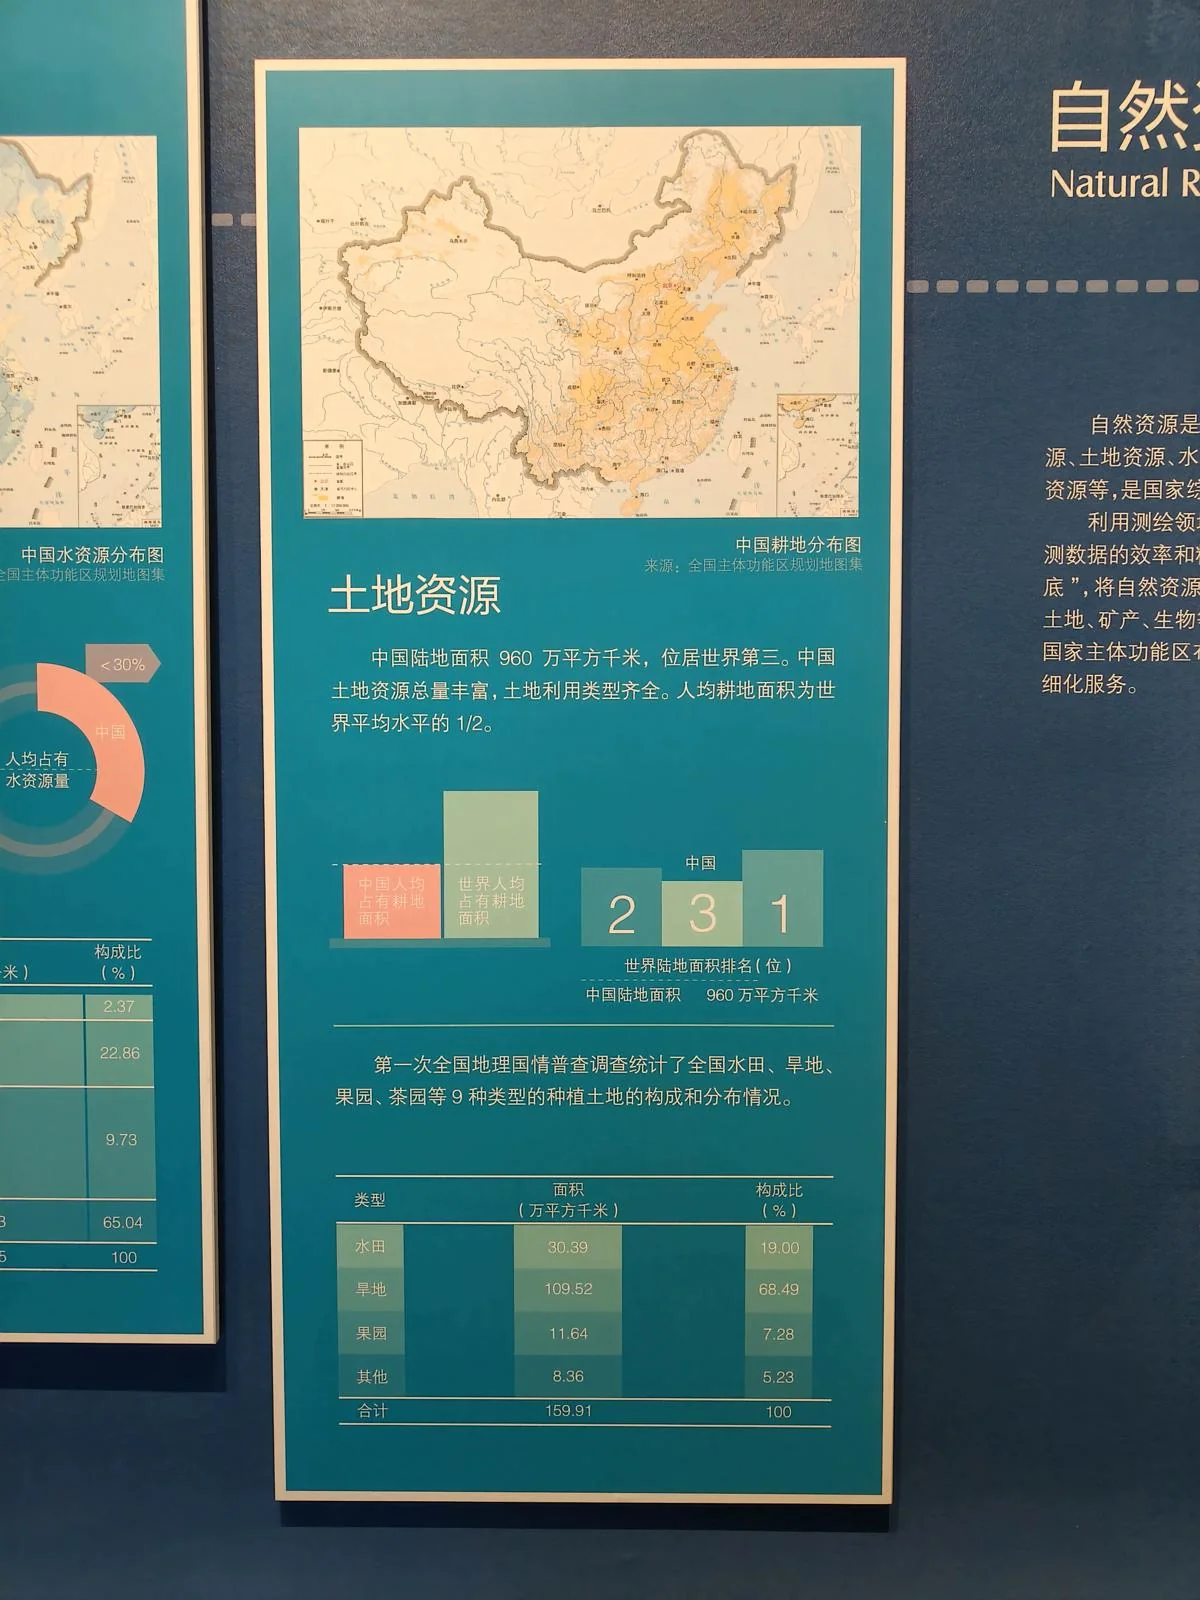
The first national geographical census determined the breakdown of cultivated land:
| Type | Area (10,000 sq km) | Percentage (%) |
|---|---|---|
| Paddy Field | 30.39 | 19.00 |
| Dry Land | 109.52 | 68.49 |
| Orchard | 11.64 | 7.28 |
| Other | 8.36 | 5.23 |
| Total | 159.91 | 100 |
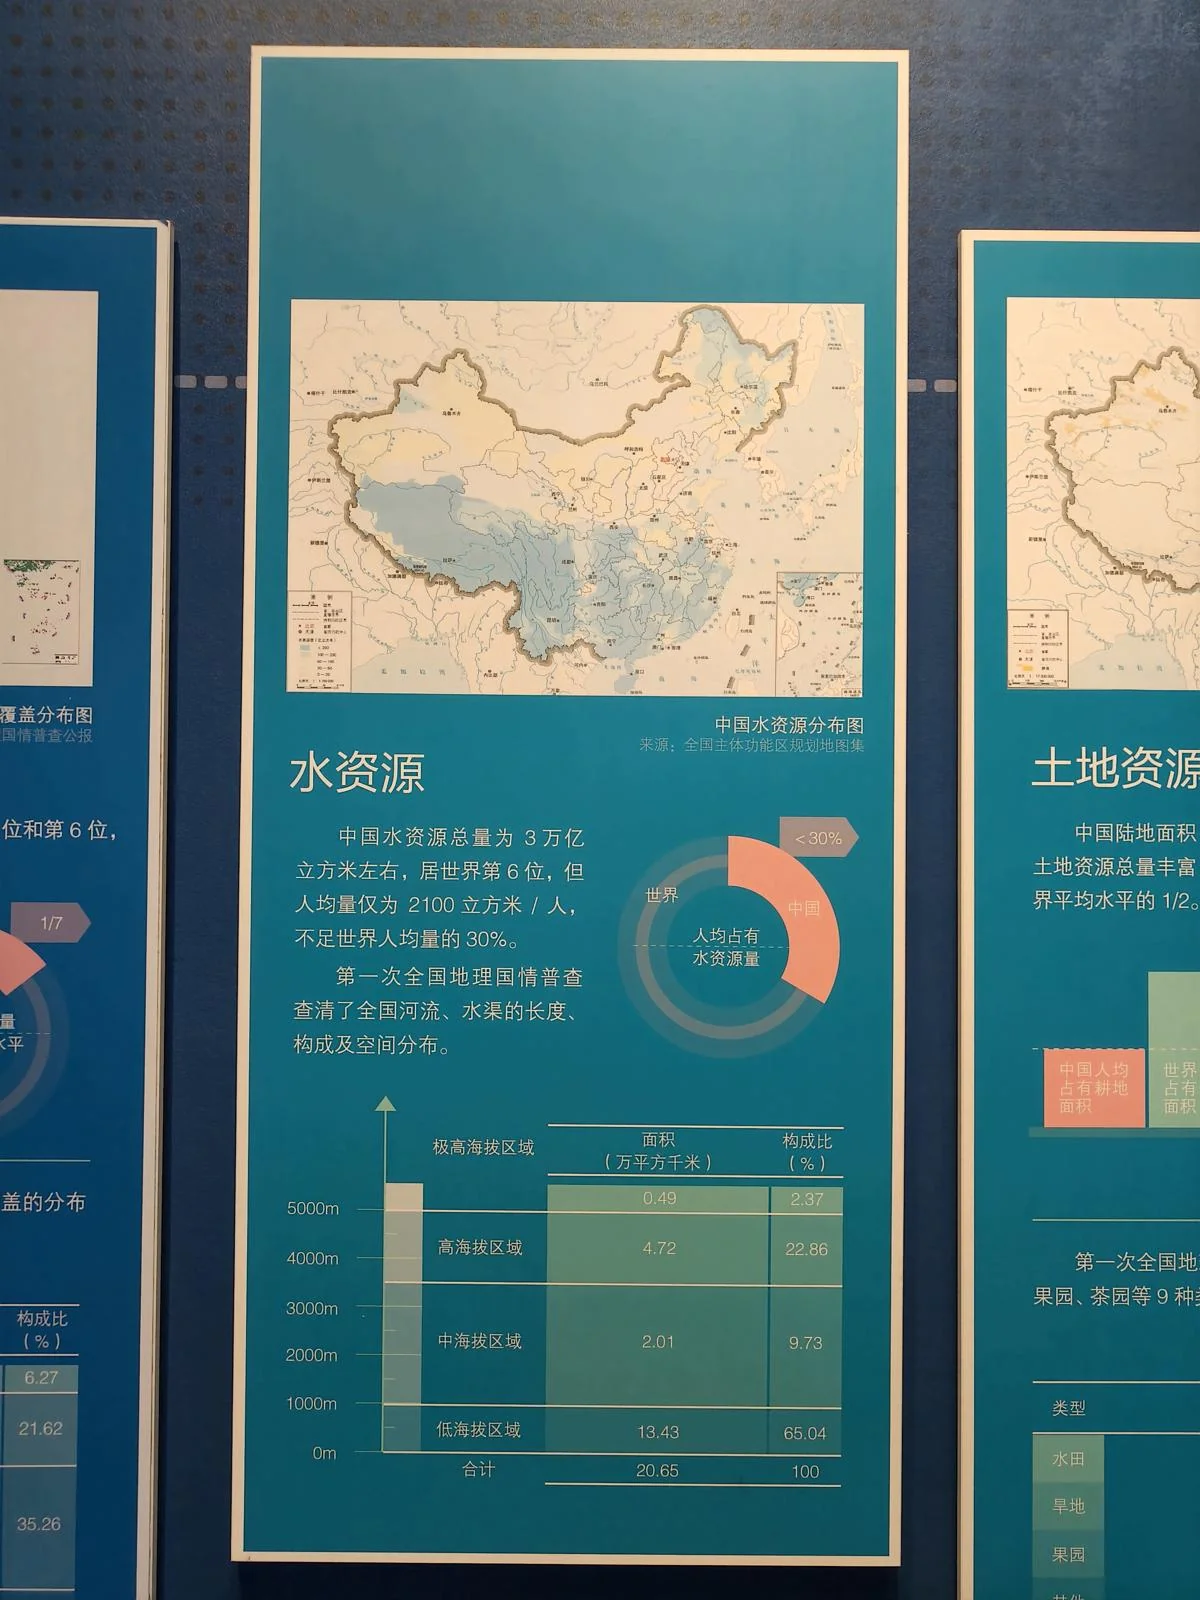
It also tallied the distribution of water resources by altitude:
| Region | Area (10,000 sq km) | Percentage (%) |
|---|---|---|
| Extremely High Altitude | 0.49 | 2.37 |
| High Altitude | 4.72 | 22.86 |
| Medium Altitude | 2.01 | 9.73 |
| Low Altitude | 13.43 | 65.04 |
| Total | 20.65 | 100 |
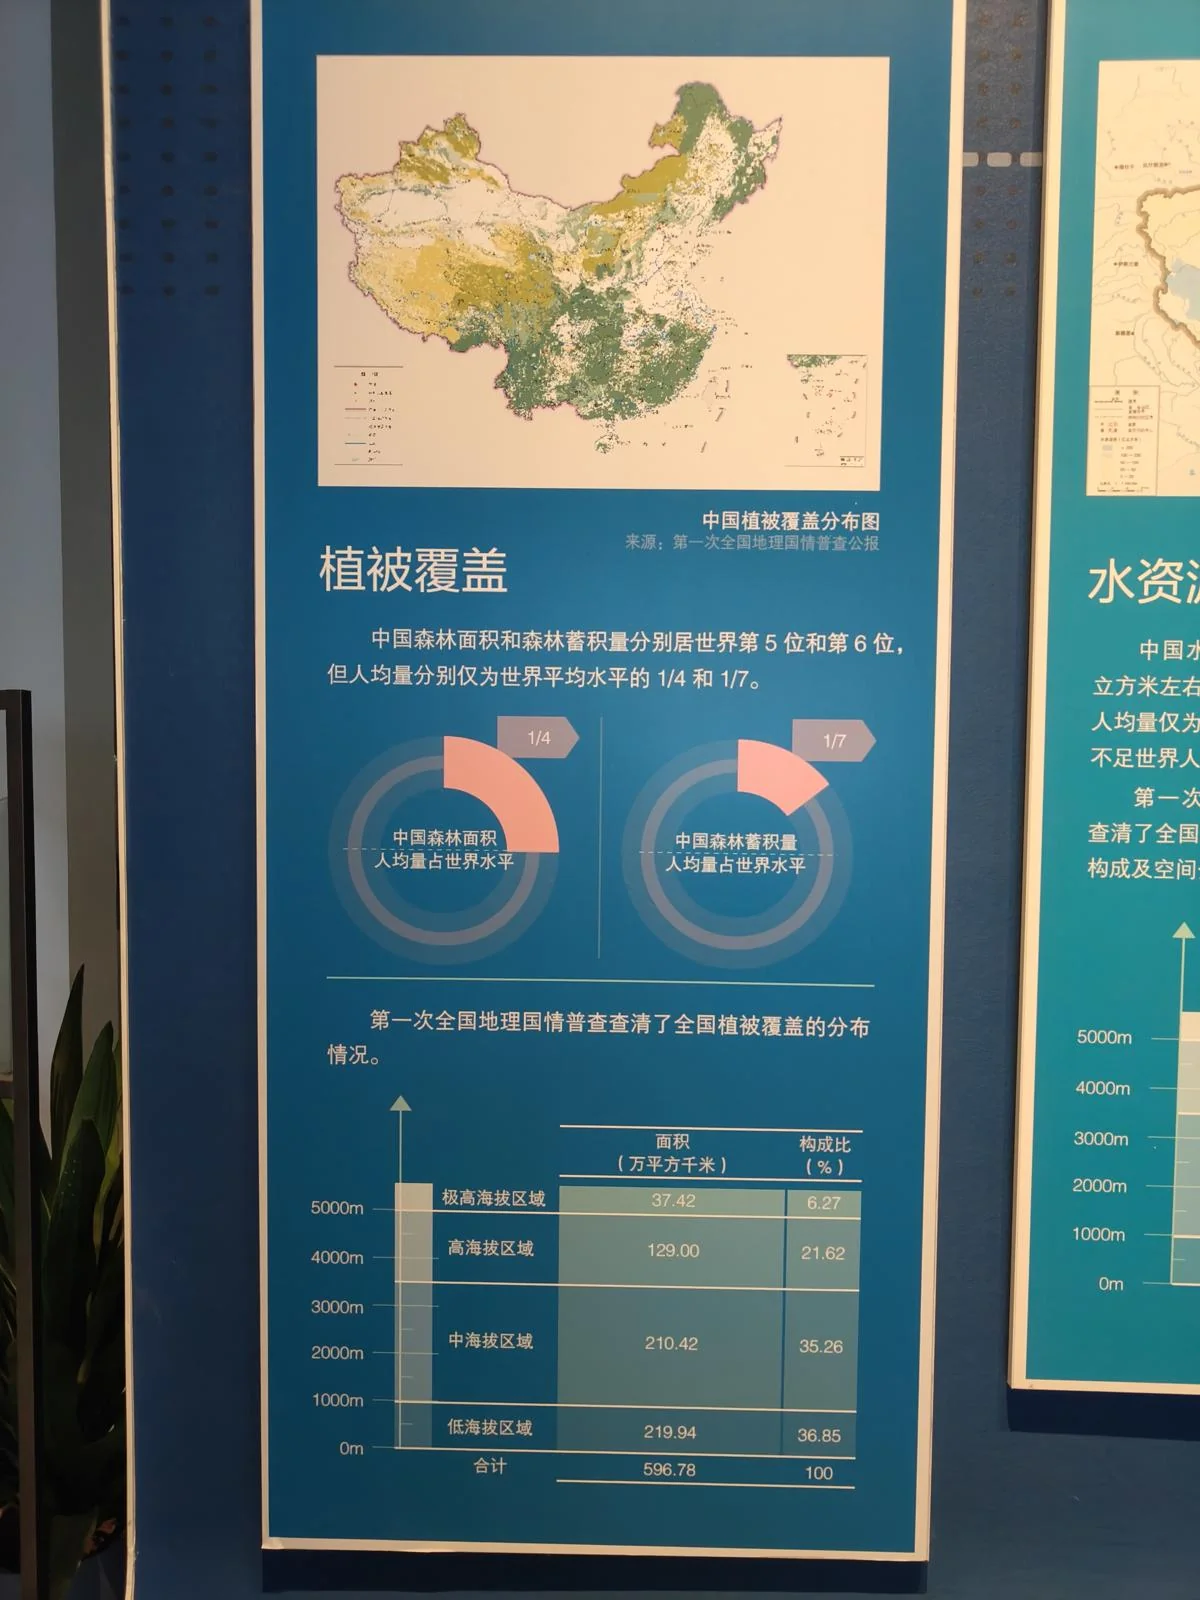
And vegetation cover by altitude:
| Region | Area (10,000 sq km) | Percentage (%) |
|---|---|---|
| Extremely High Altitude | 37.42 | 6.27 |
| High Altitude | 129.00 | 21.62 |
| Medium Altitude | 210.42 | 35.26 |
| Low Altitude | 219.94 | 36.85 |
| Total | 596.78 | 100 |
Further on, an exhibit detailed the three measurements of Mount Everest’s height. The latest official height is 8848.86 meters to the “snow surface.” You can easily find the story behind this online.
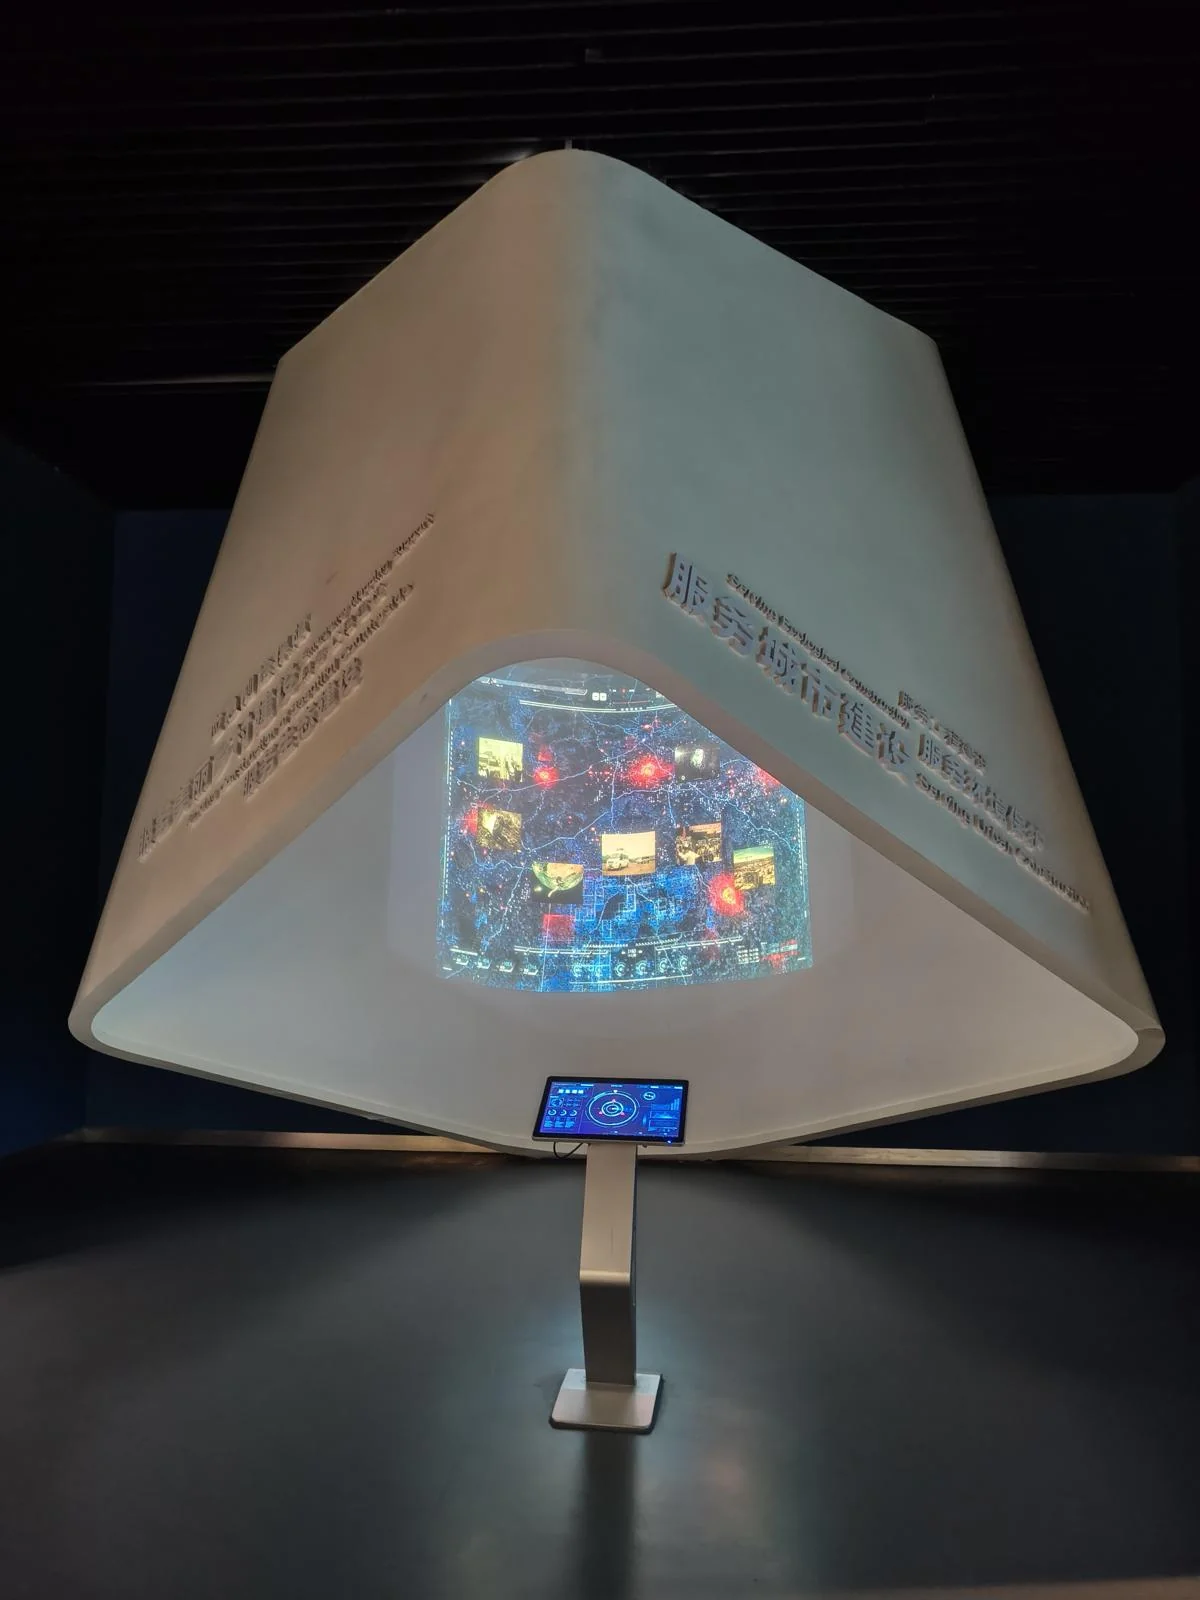
I passed a futuristic installation with a sleek console and an oddly shaped screen, like something from an alien spaceship.
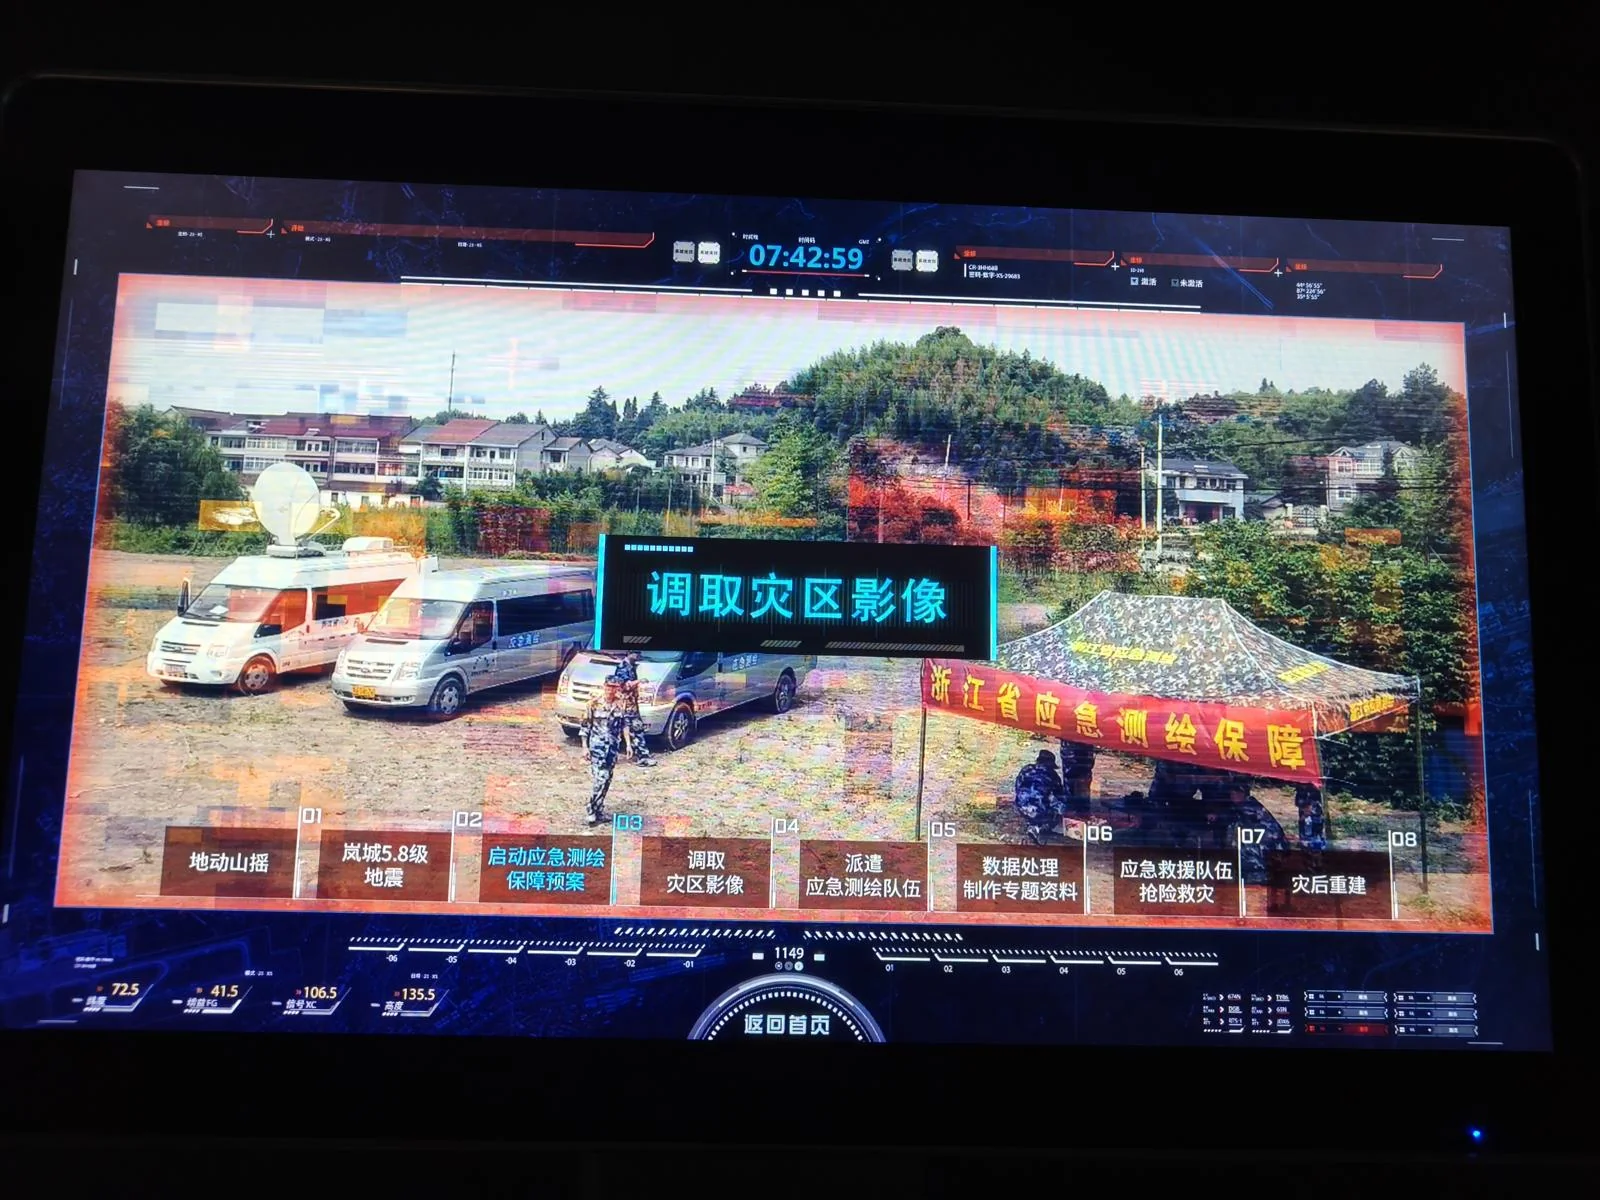
It was an interactive exhibit on how survey data is used for earthquake disaster relief.
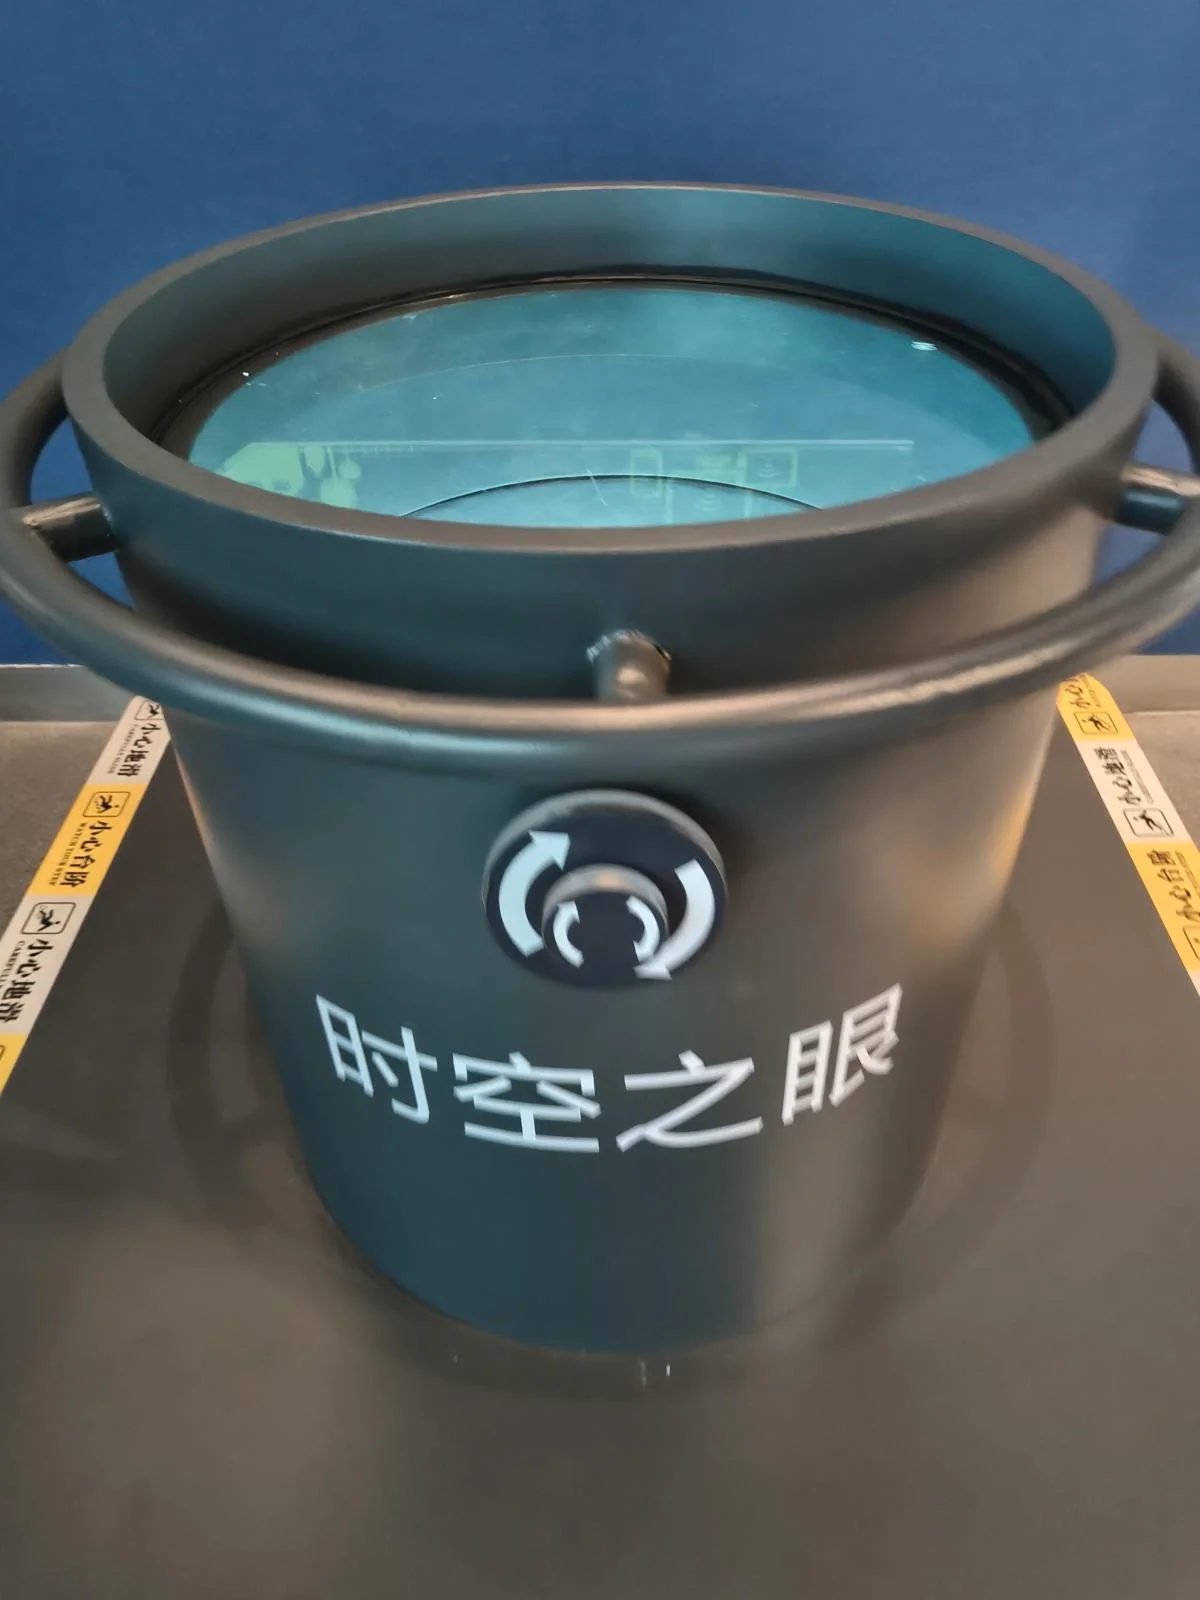
Another clever device: rotating discs on a barrel showed the historical changes of cities in Zhejiang.

The modern section on the first floor was much larger than I’ve shown. I didn’t photograph many of the display boards with dense text.
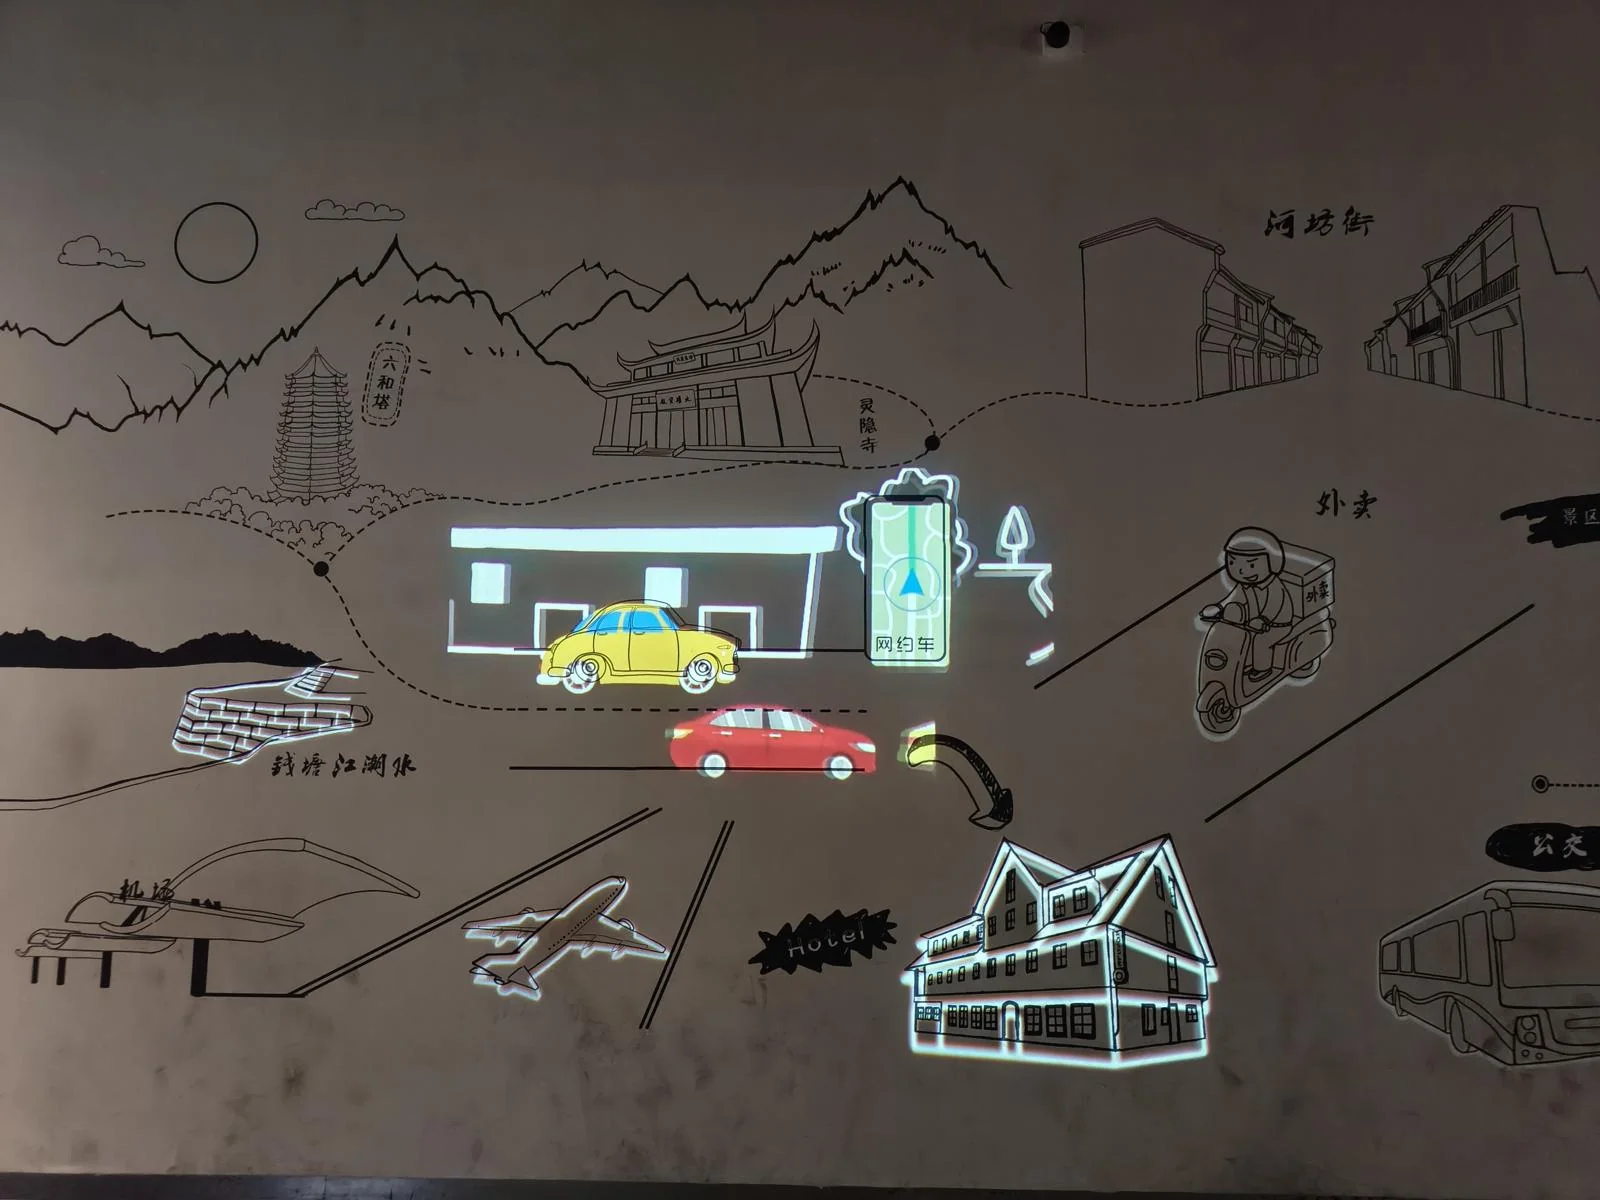
As I left the first-floor hall, I saw two opposing interactive walls. Touching a painting on the wall lit up the corresponding object, reminding visitors of the pervasive impact of surveying technology on modern society.
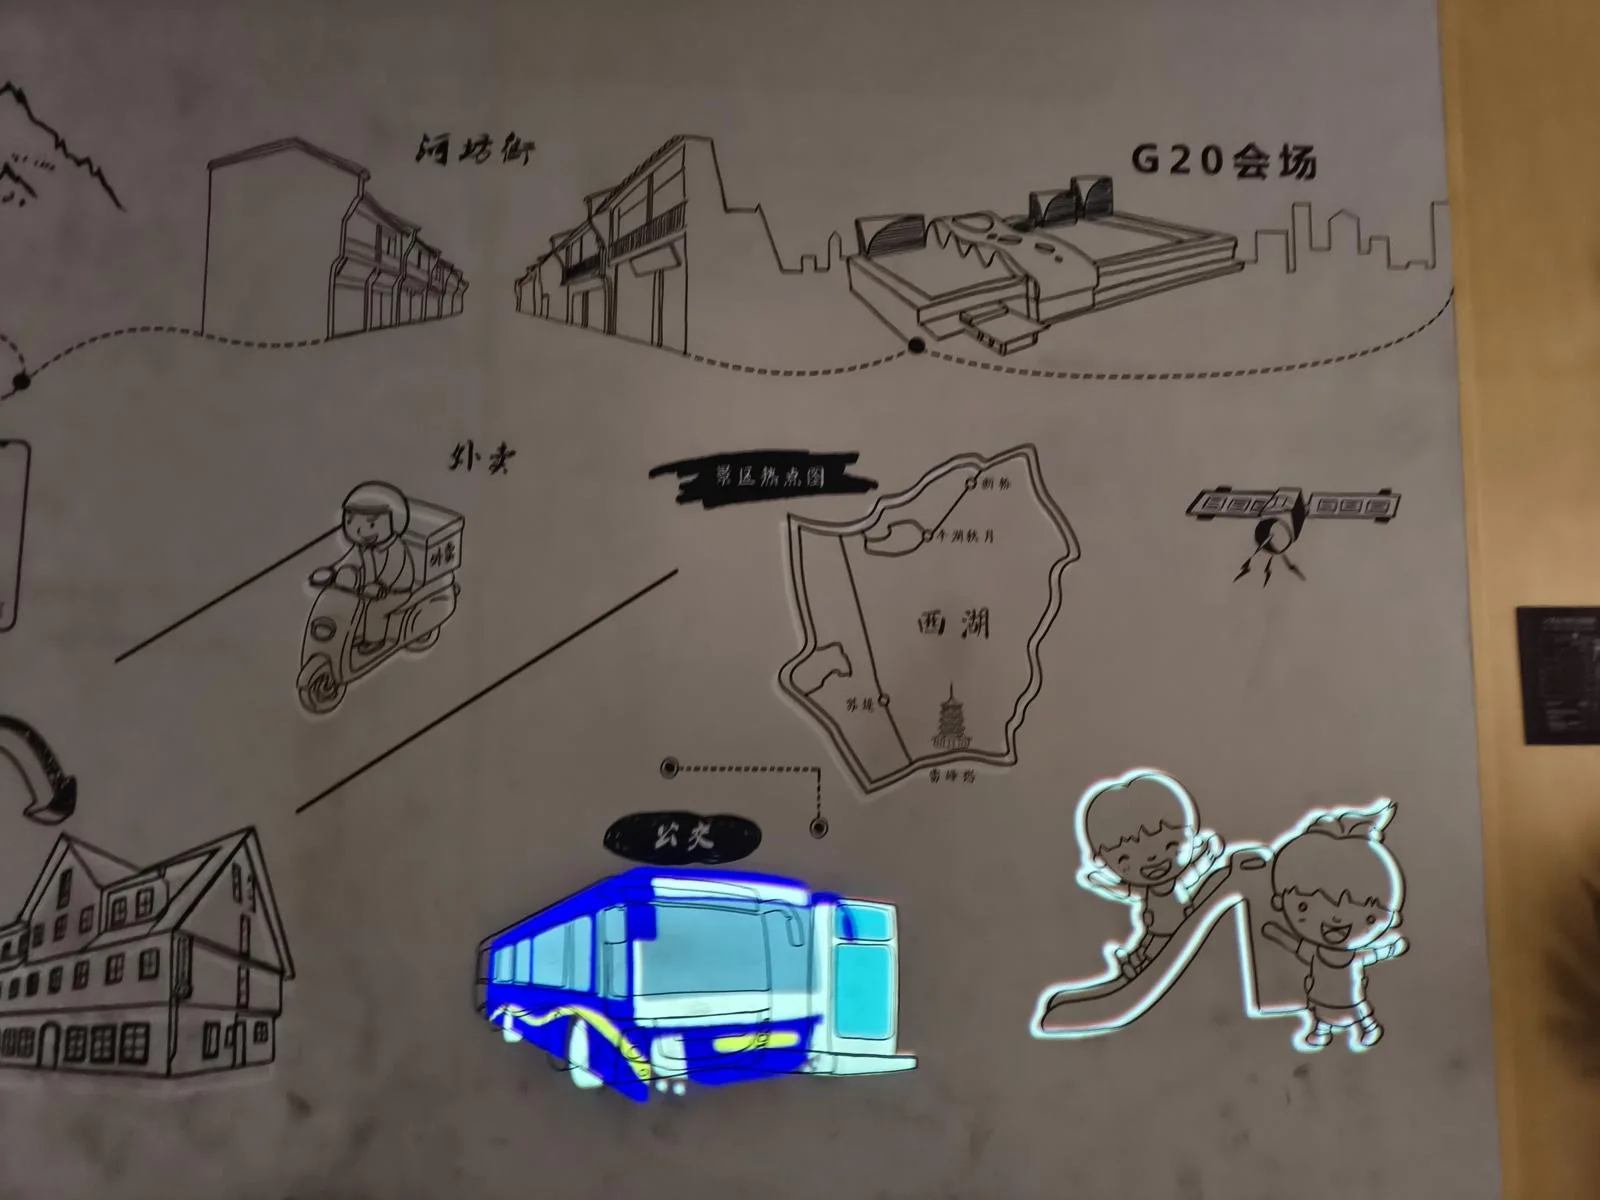
Applications of Surveying Technology
On the second floor, the focus shifted from history to the technology itself.
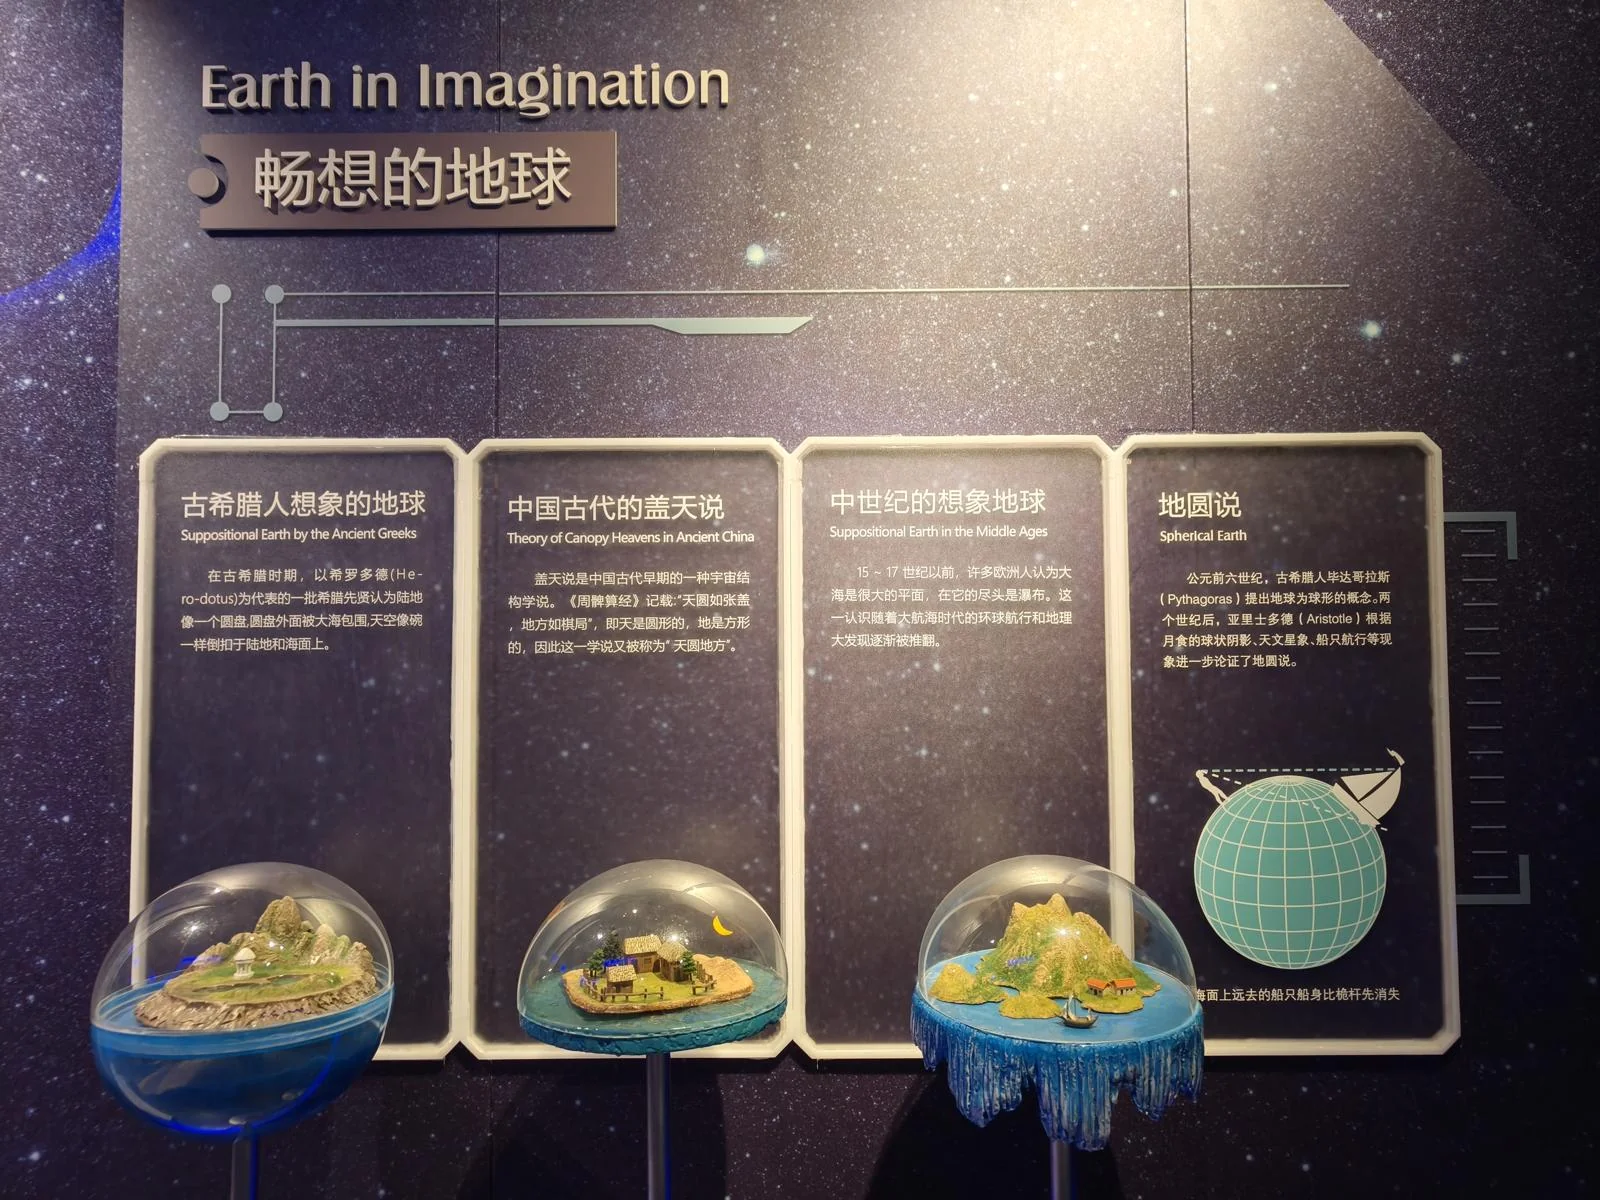
Of course, it began with a touch of history, showcasing the geographical views of different civilizations over time.
Note the timeline: the theory of a spherical Earth was proposed in the 6th century BC. Two centuries later, there was already strong evidence to support it.
In the 6th century BC, the ancient Greek Pythagoras proposed the concept of a spherical Earth. Two centuries later, Aristotle further argued for it based on the spherical shadow during a lunar eclipse, astronomical observations, and the way ships disappear over the horizon.
Yet, nearly 2,000 years later, most people still believed the Earth was a flat disc.
Before the 15th-17th centuries, many Europeans believed the ocean was a vast, flat plane ending in a waterfall. This view was gradually overturned during the Age of Discovery.
It’s a powerful reminder of how long it can take for a now-obvious truth to overcome cognitive inertia. It also makes you wonder: what if the scientific spirit of ancient Greece had continued uninterrupted?
Numerical Measurement
Once we knew the Earth was a sphere, we had to measure it.
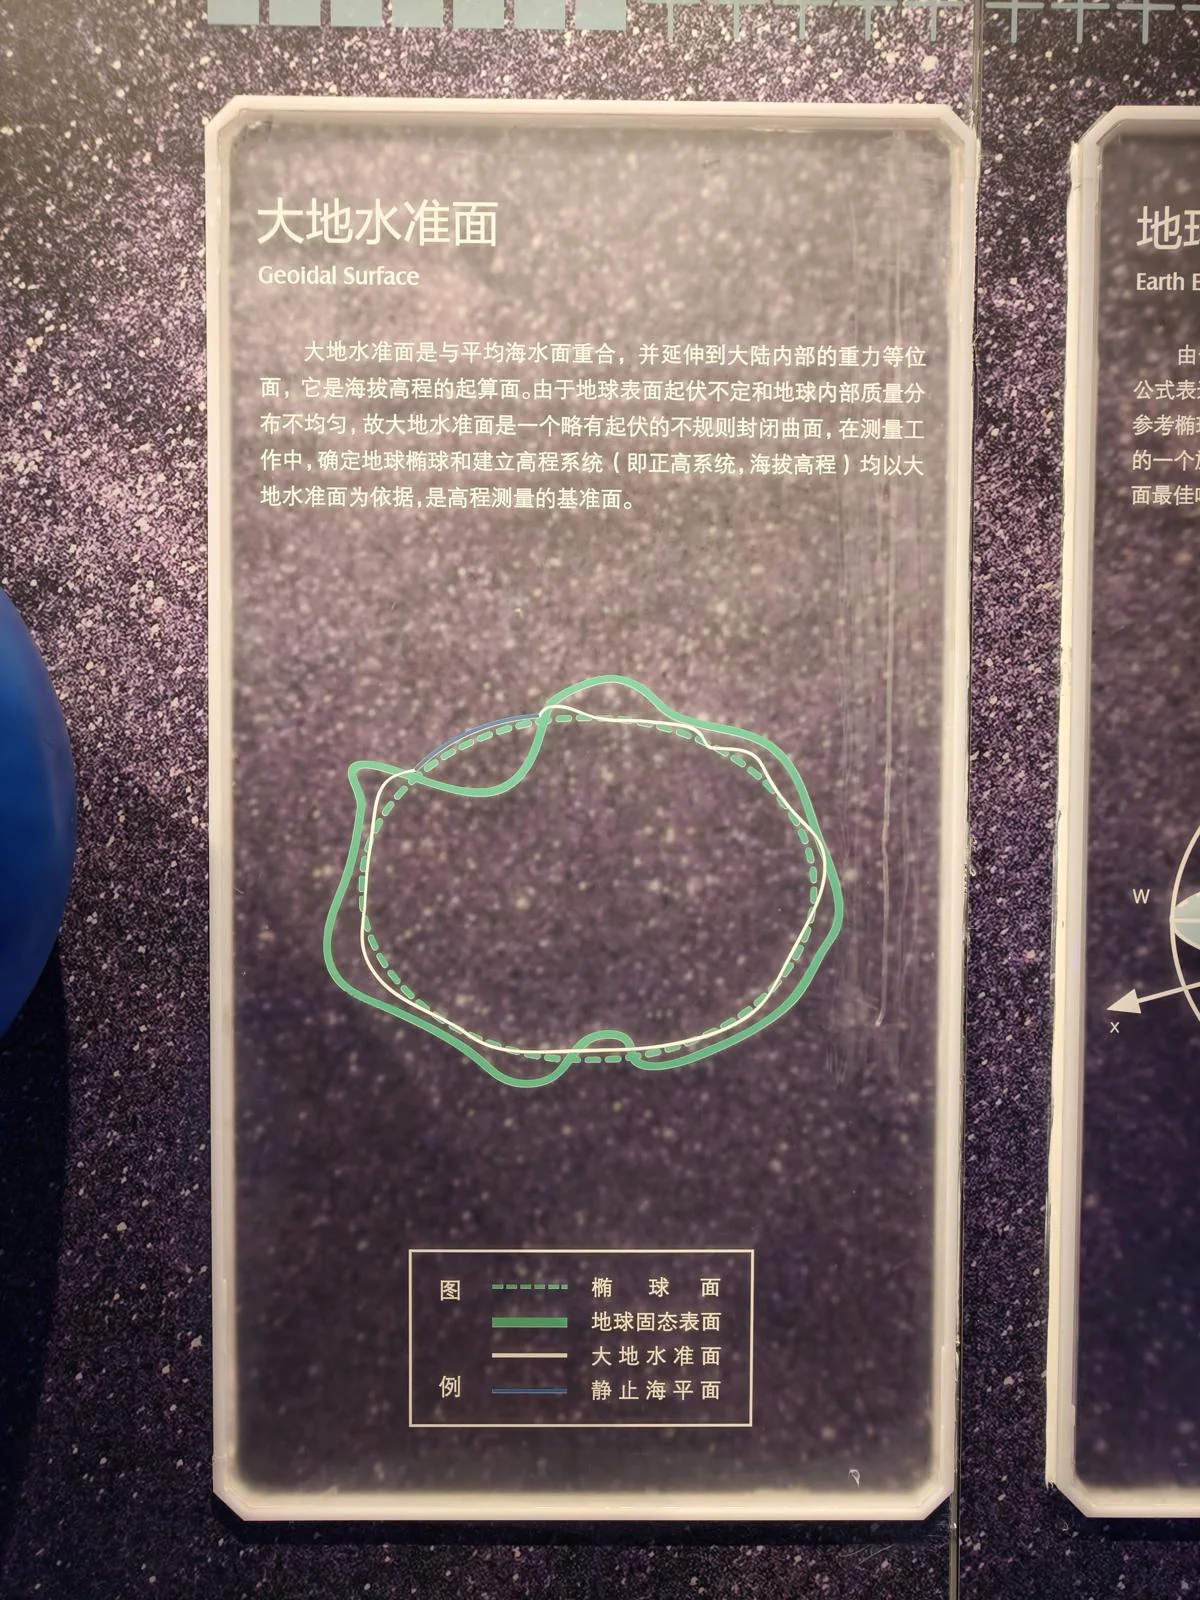
A few related but distinct concepts are at play here. Imagine the Earth as a perfect ellipsoid (the green dashed line). The actual solid surface (mountains, seabeds) is uneven (the solid green line). You can’t use this uneven surface as a baseline for measuring height. A more uniform reference is sea level (the solid white line). But because Earth’s mass isn’t evenly distributed, the sea level (the geoid) doesn’t perfectly match a standard ellipse.
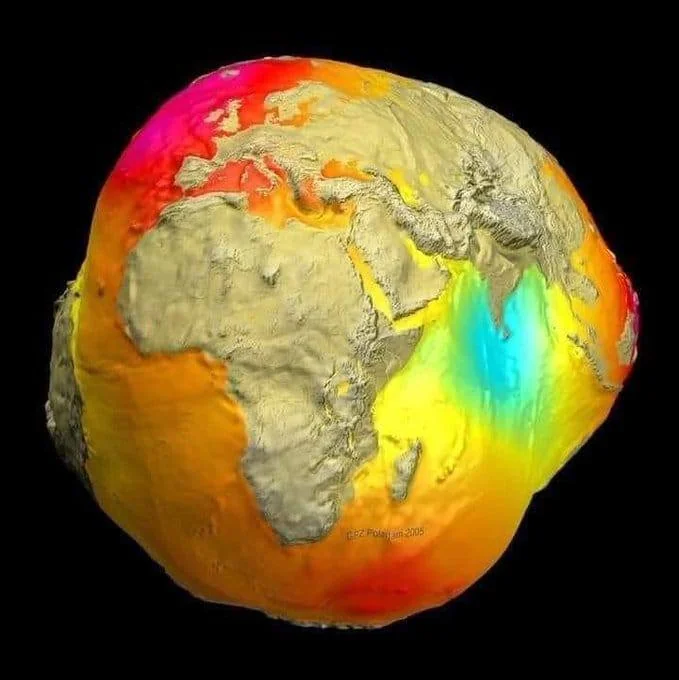
Coincidentally, I’d just seen a NASA image of the geoid on social media. It gives you a great visual for how much the geoid, shaped by gravity, differs from a perfect sphere.
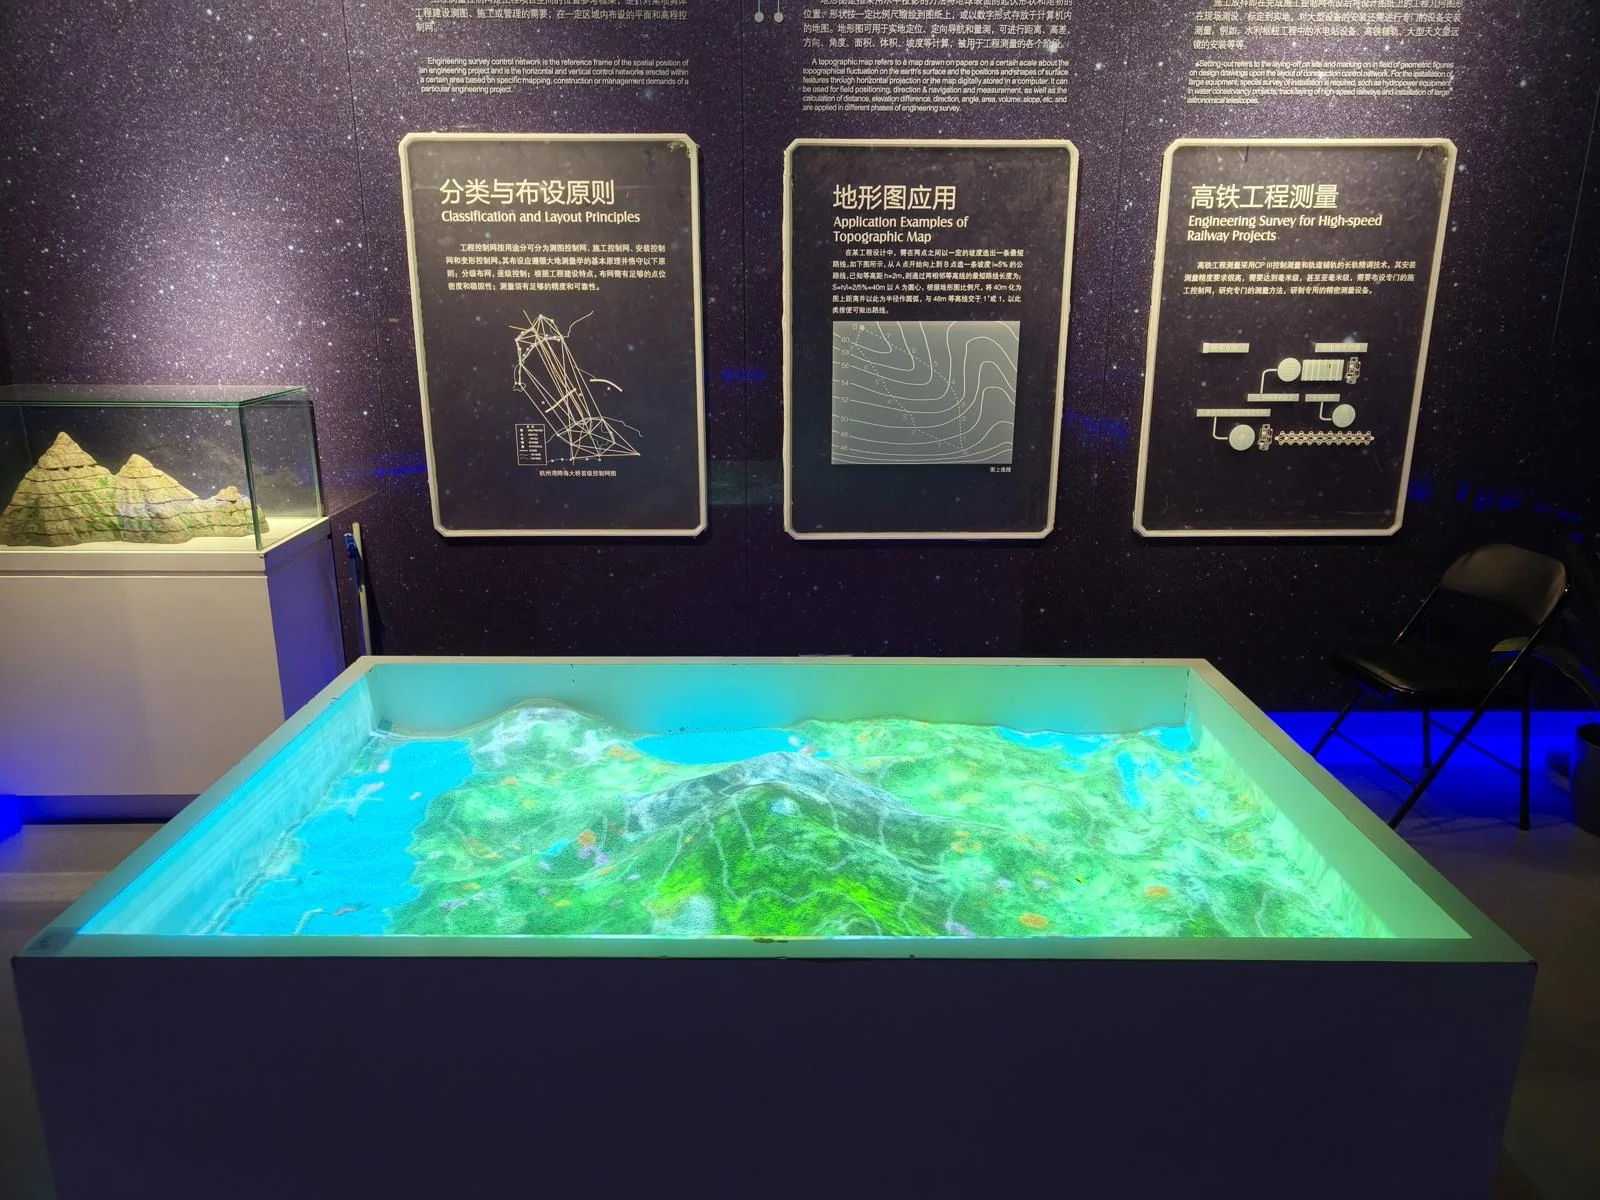
This device lets you see how topographic maps are made. Using the geoid concept, imagine slicing the Earth with parallel planes at regular intervals. The lines where these planes intersect the terrain are the contour lines.
You can shape the sand in the sandbox, and an overhead projector instantly redraws the contour lines on the new terrain.
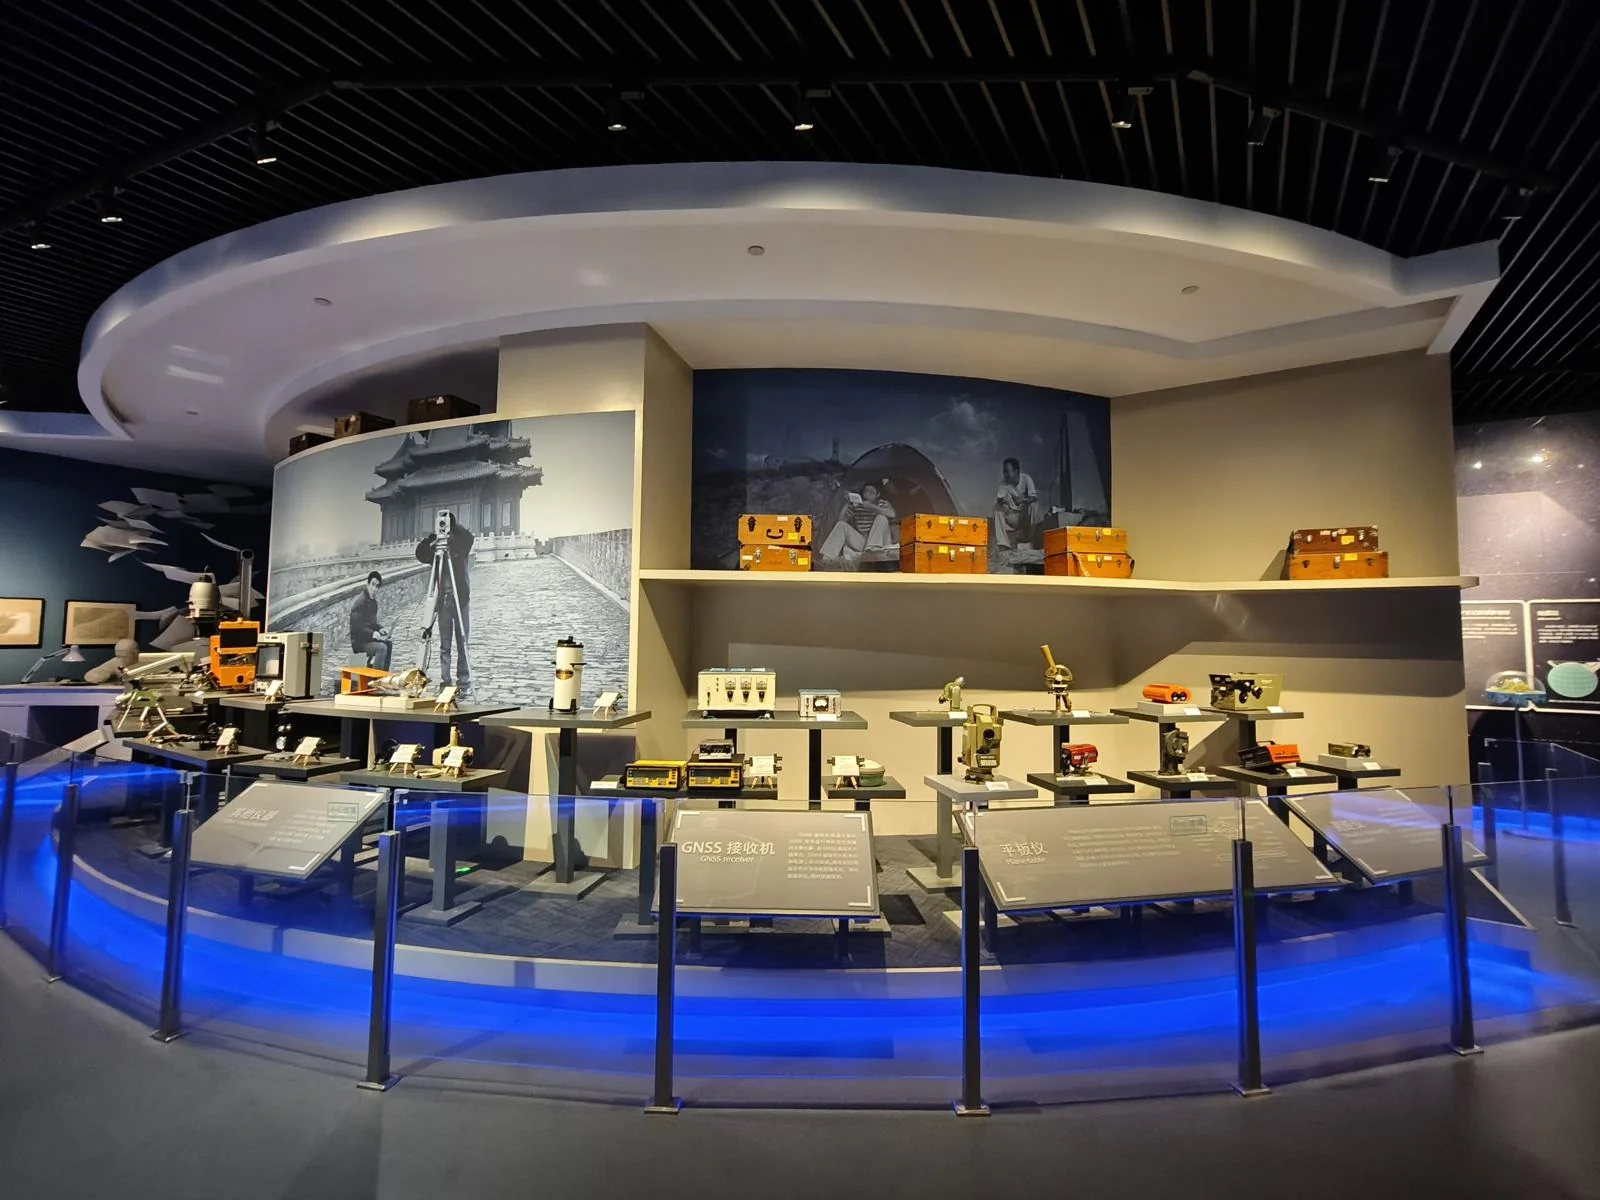
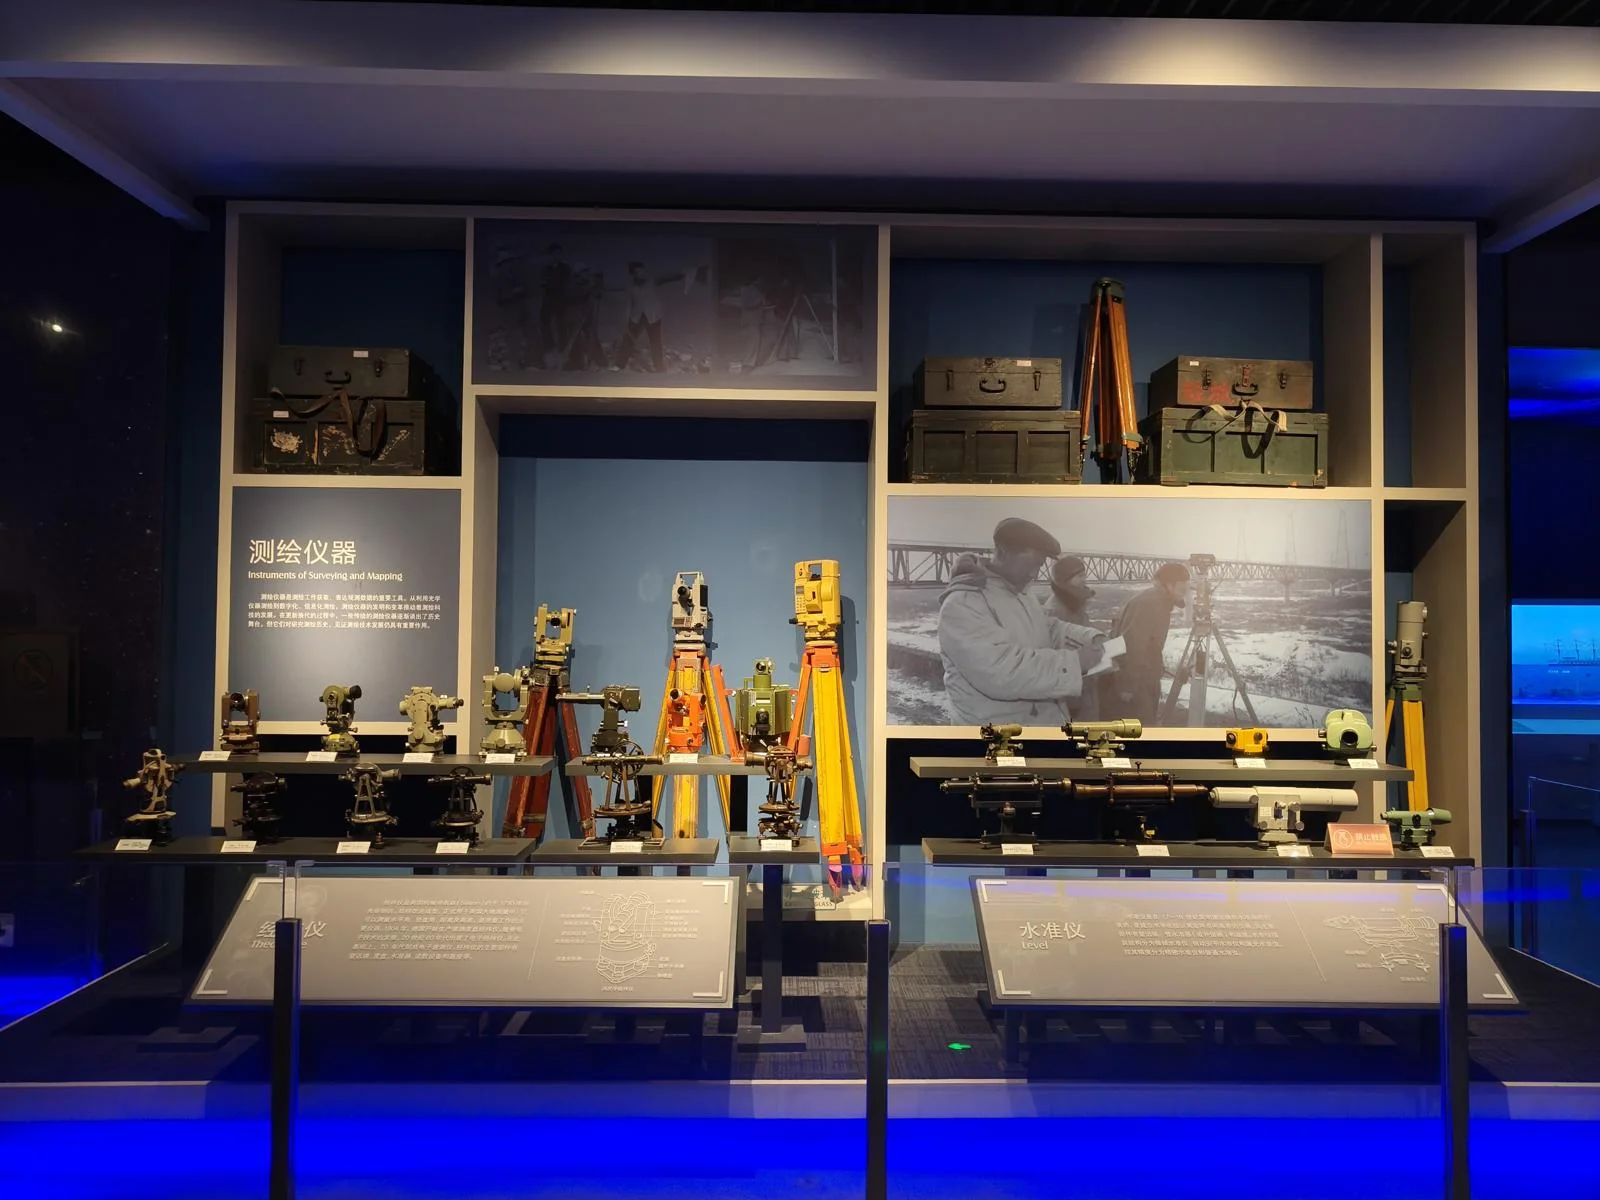
This area was lined with an impressive collection of surveying instruments.
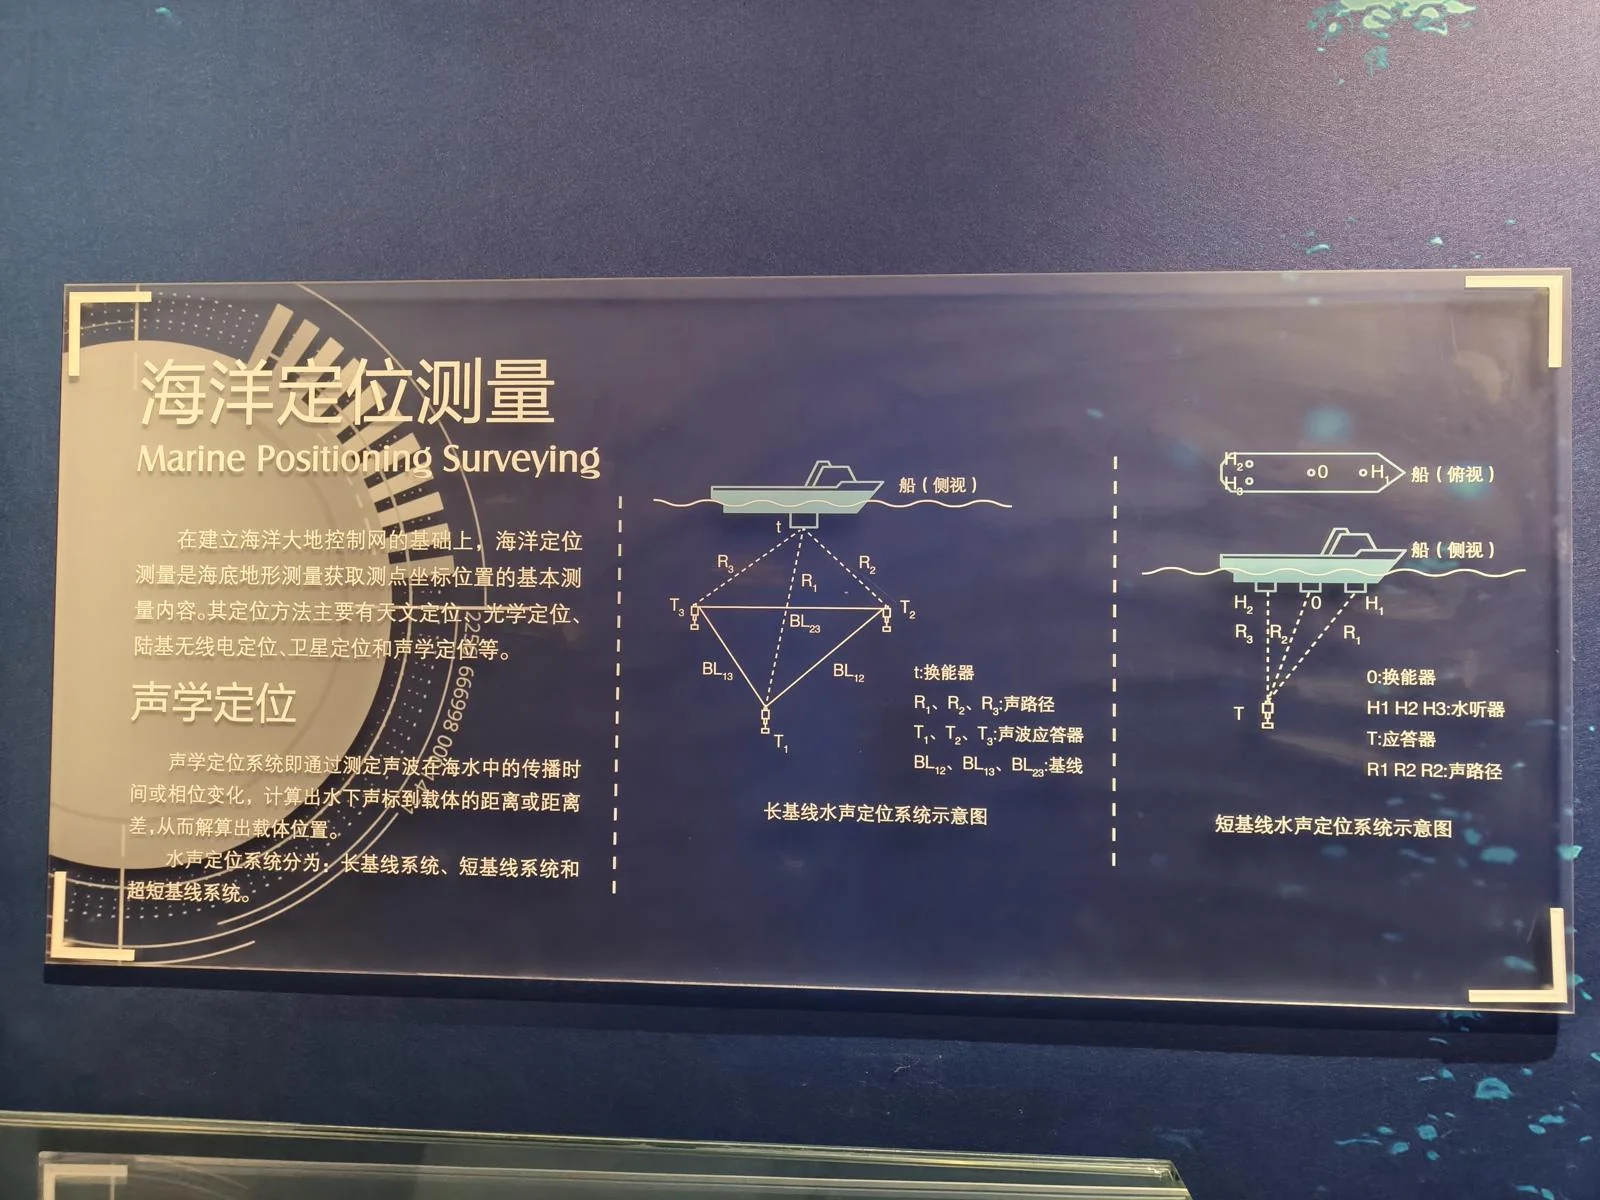
The section on marine positioning caught my eye. The diagram shows two common acoustic positioning methods for missions at sea.
The long-baseline method (left) is used for long-term projects in a fixed area, like oil drilling or cable laying. A ship deploys an array of transponders on the seabed and calibrates their positions to centimeter-level accuracy. The ship can then use signals from at least three transponders to pinpoint its own location with extreme precision.
The short-baseline method is used to track moving underwater objects, like ROVs. It works in reverse: the ship emits a sound wave, and receivers at three different points on the ship listen for the object’s reply, calculating its position for precise control.
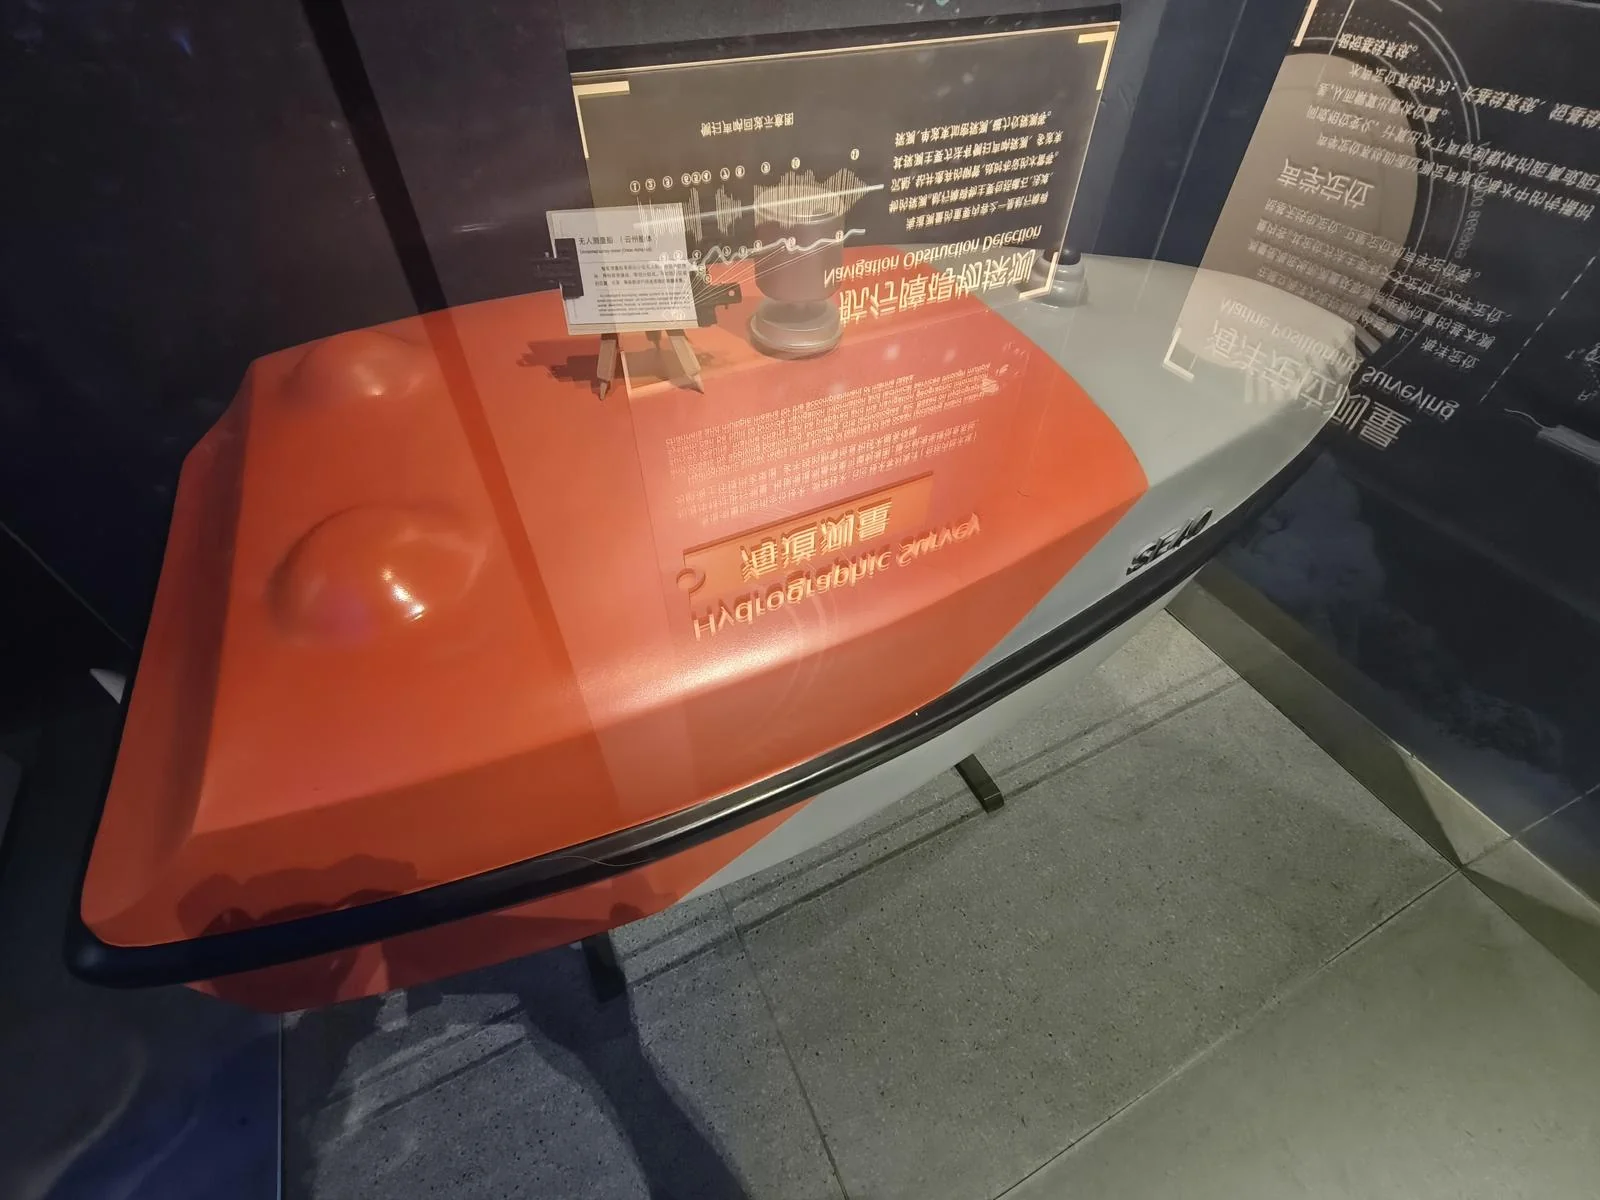
The unmanned survey boat is surprisingly small.
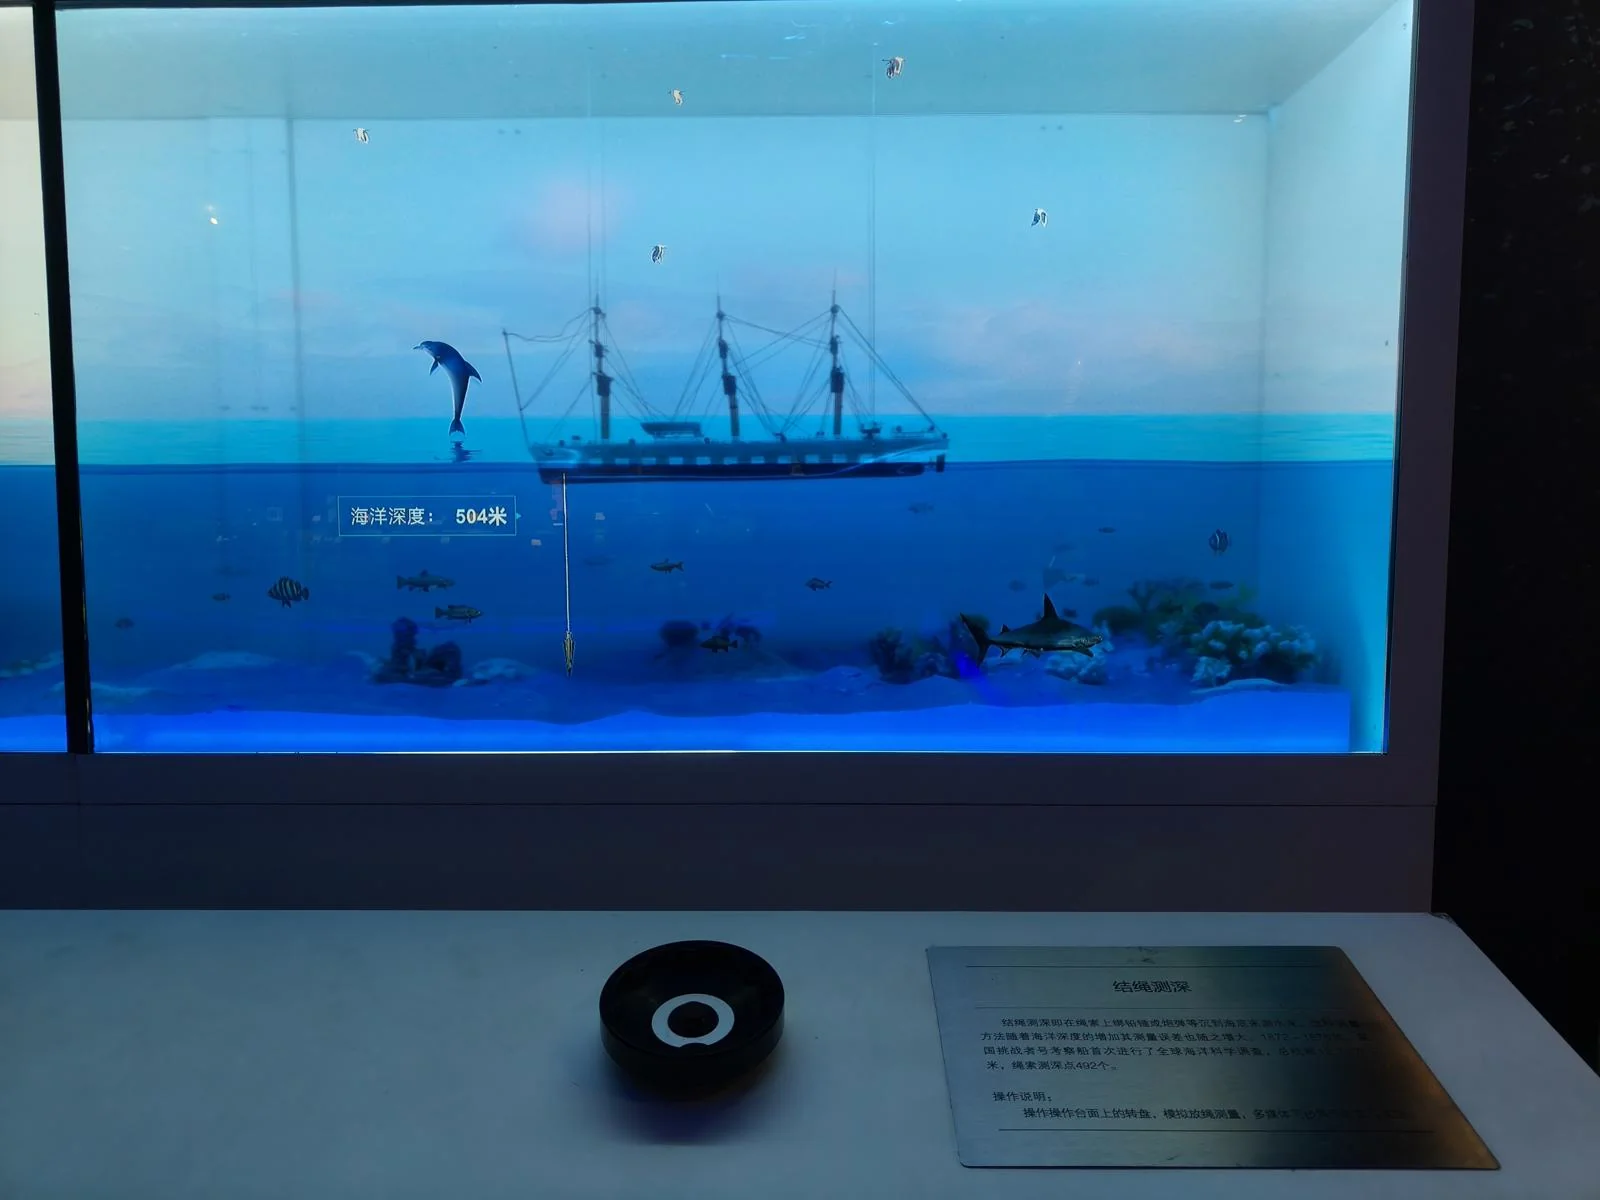
This exhibit showed the evolution of underwater survey technology. Ancient methods involved lowering a weighted, knotted rope and counting the knots to determine depth.
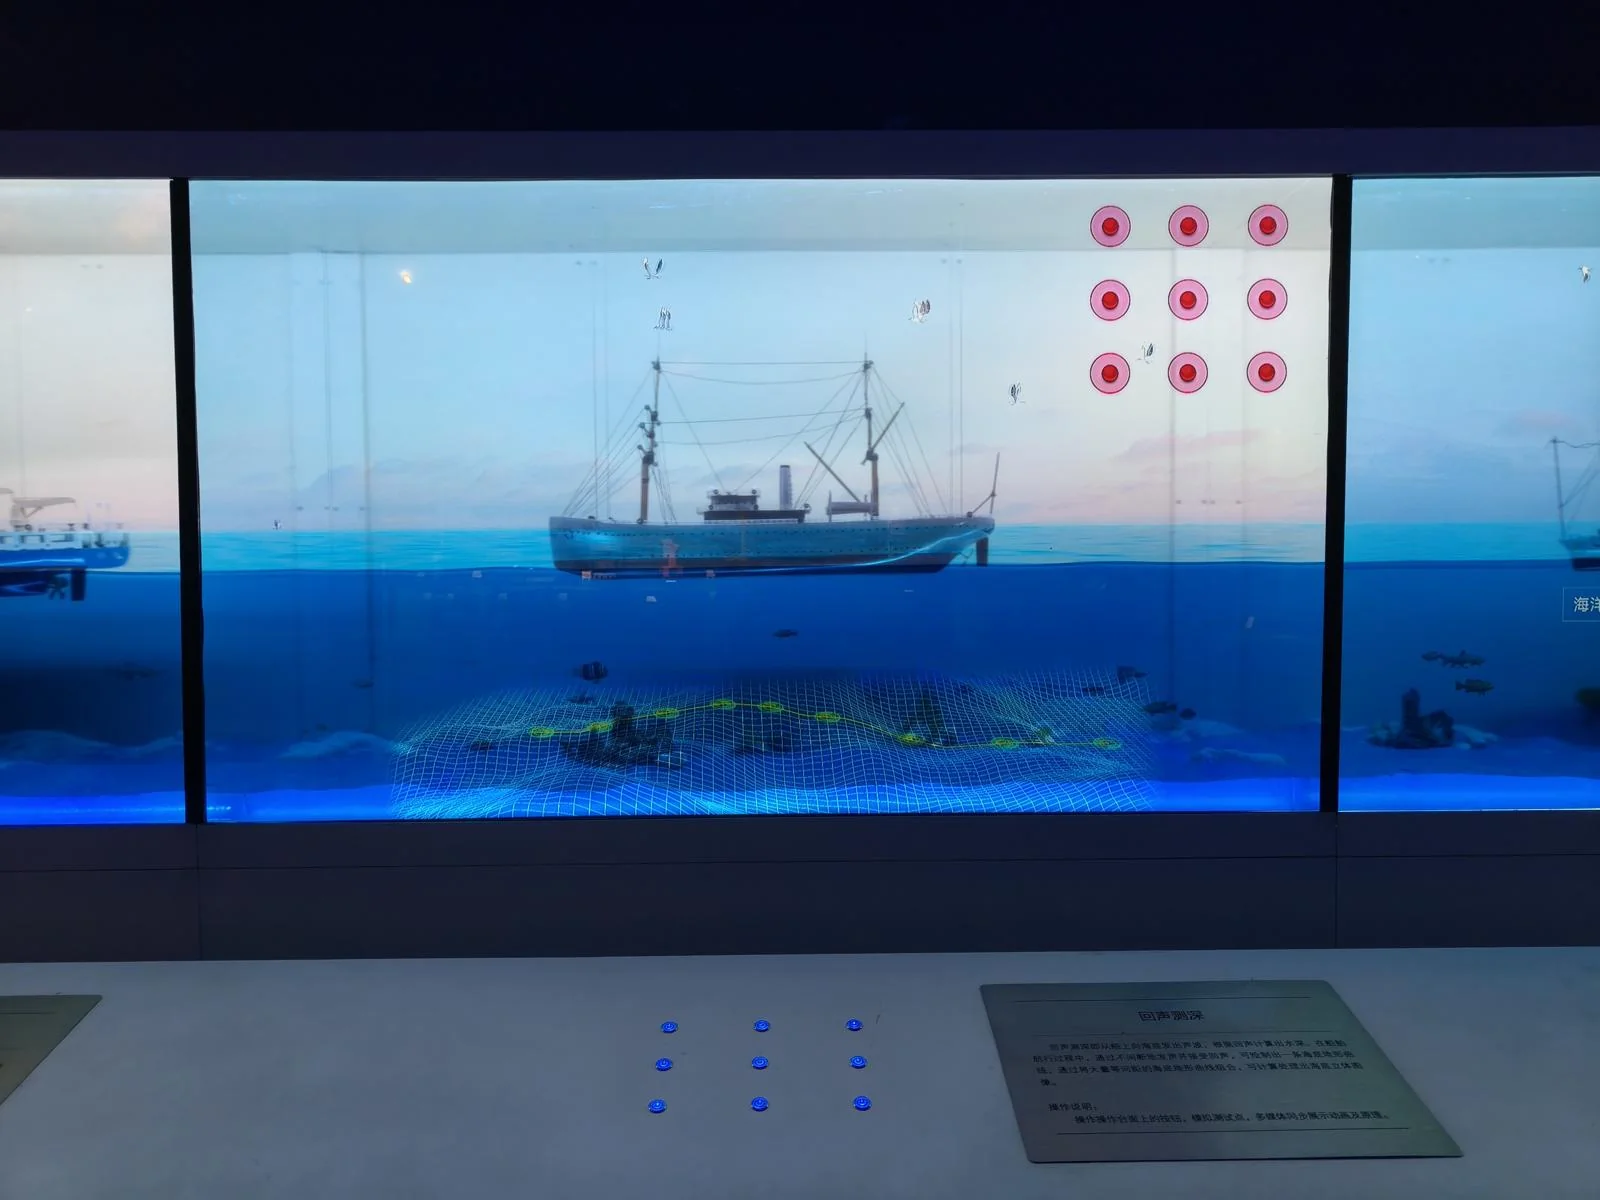
With sonar, you can measure the depth along a ship’s path.
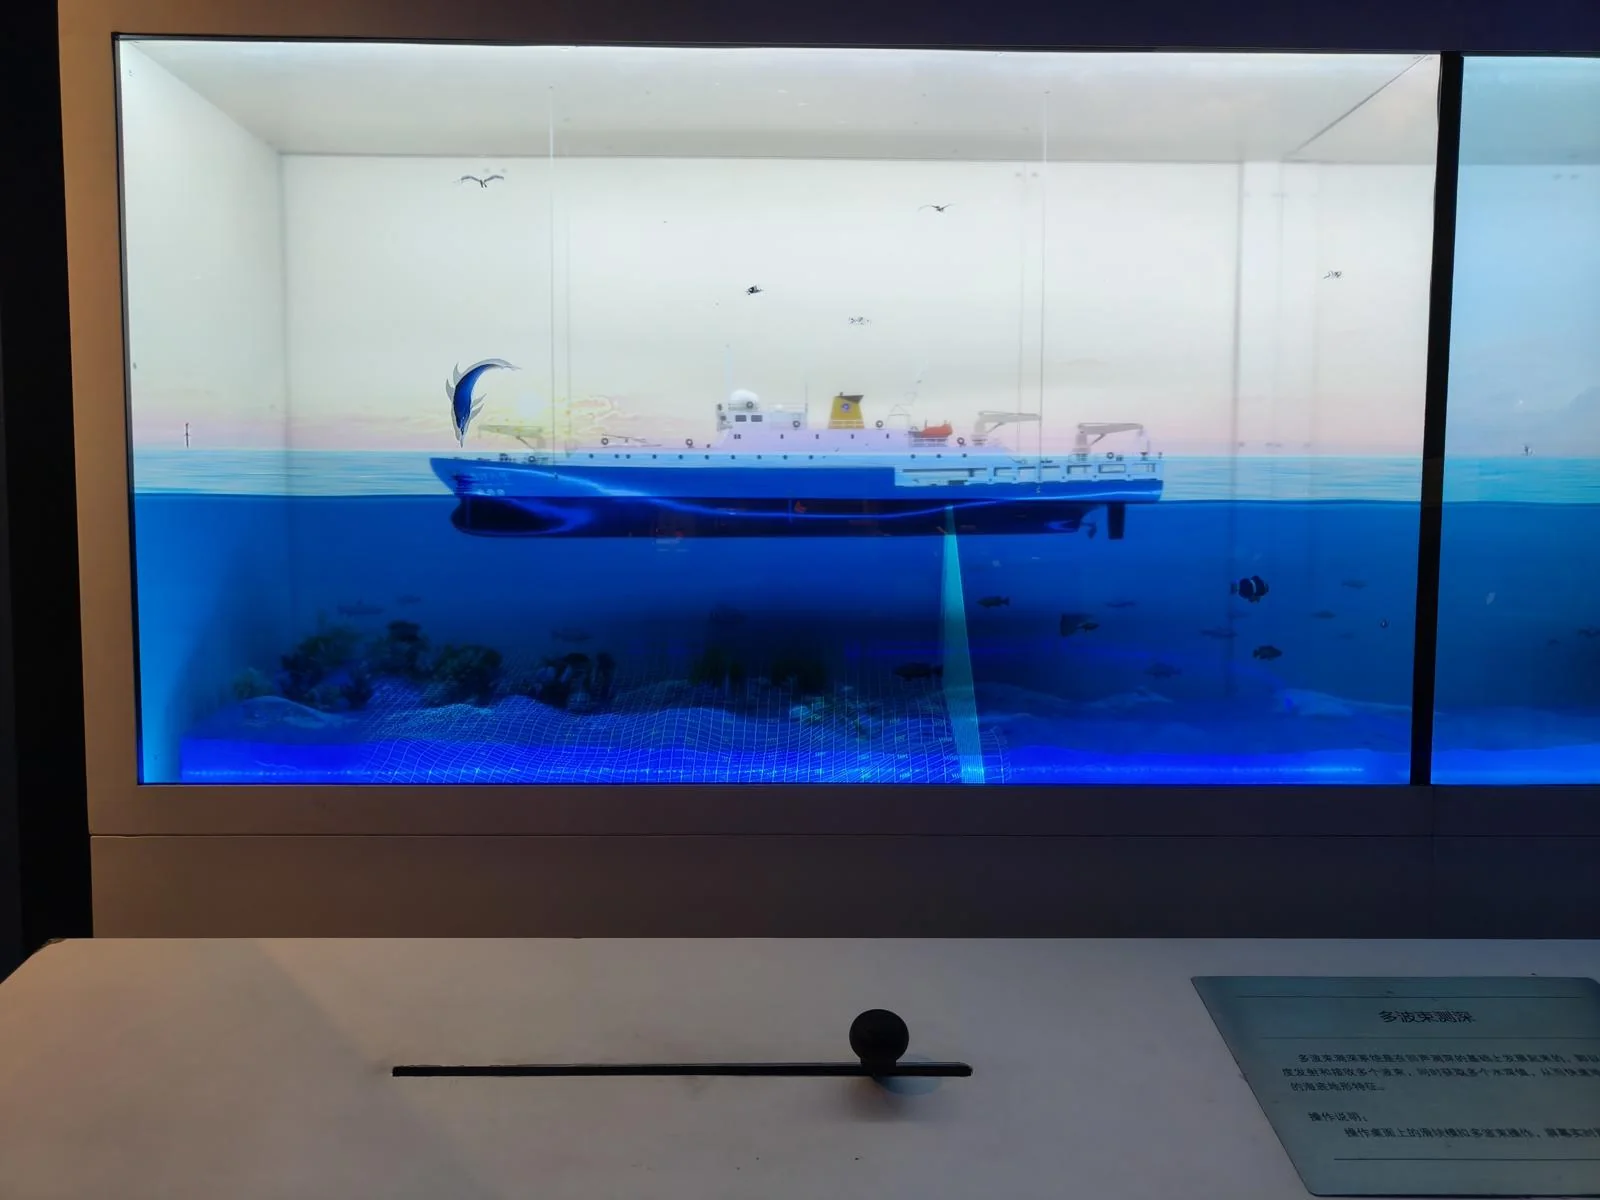
Multibeam sonar scans a wide swath at once, creating a full 3D image of the seafloor, not just a line of depth soundings.
And so, we land-dwellers have a detailed understanding of the ocean floor. Our maps can even reflect submarine topography.
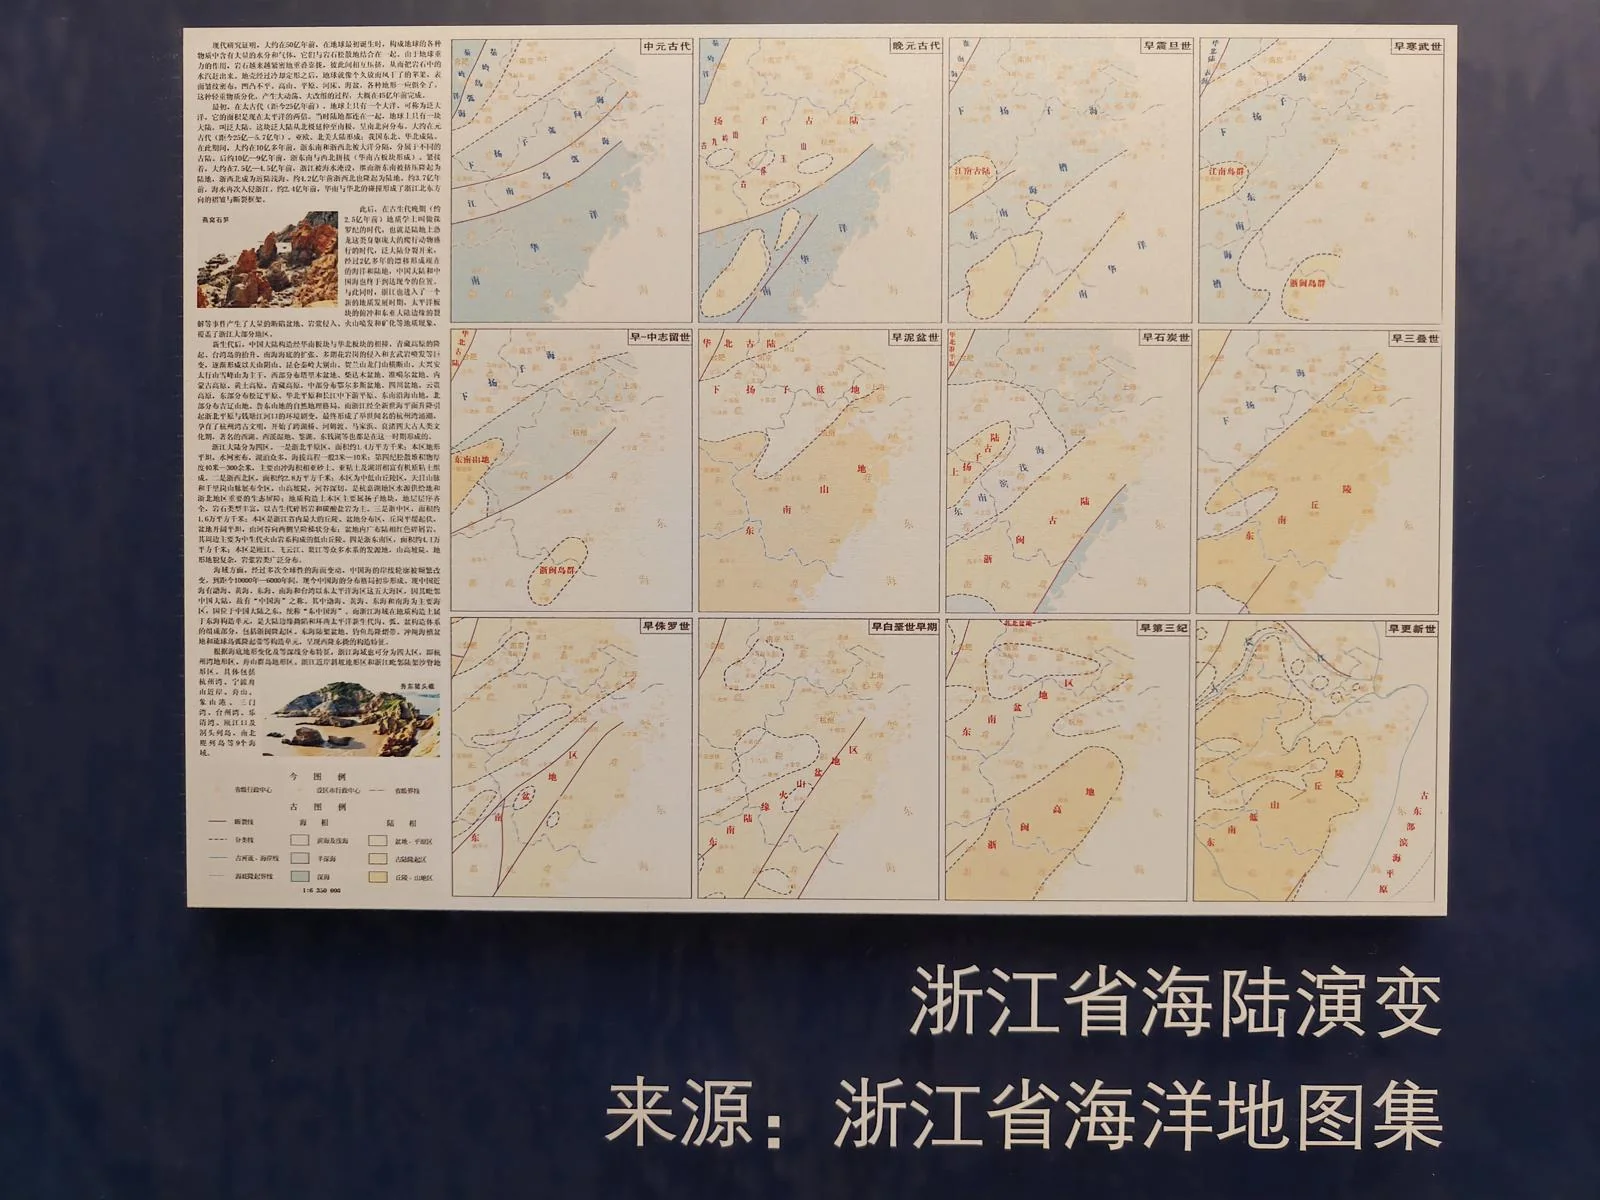
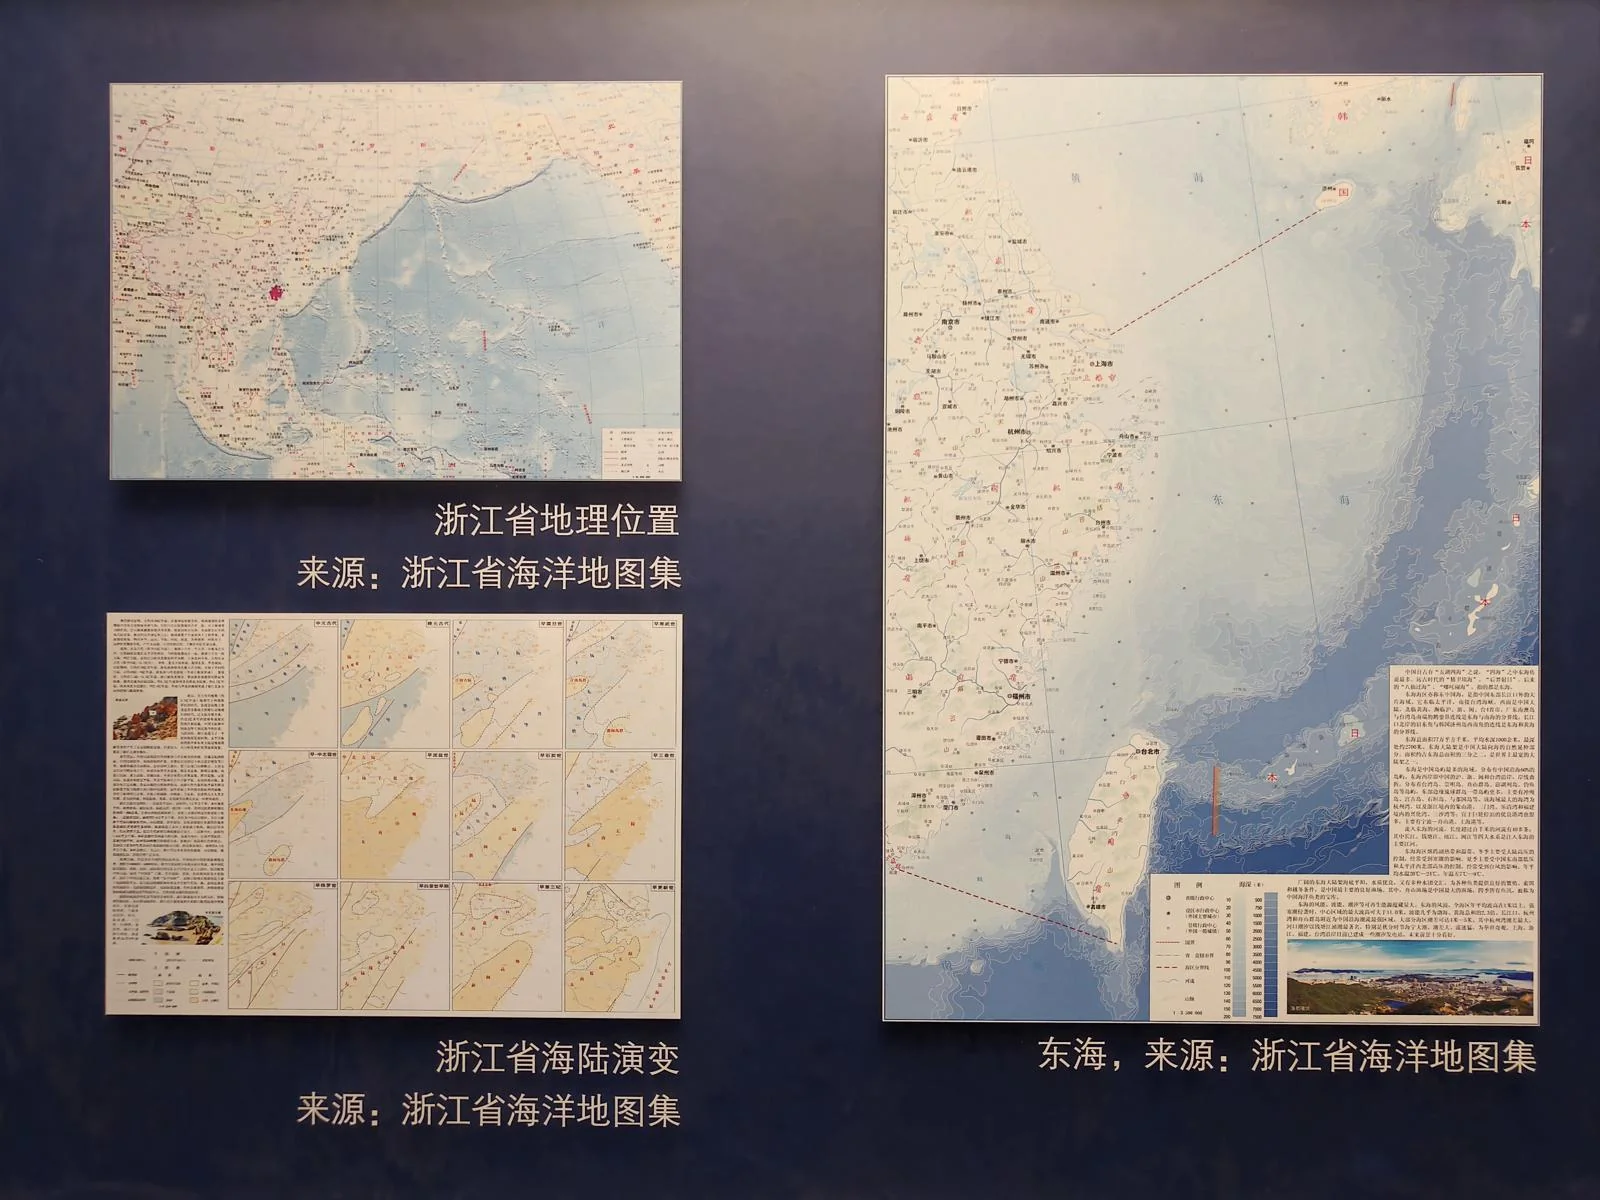
We can also map topography across time. This diagram shows how the coastline of the Zhejiang region has changed over geological eras.
Image-based Measurement
With modern computer vision and AI, a new path to surveying has opened up: visual measurement, or remote sensing. We capture images and analyze the data within them.
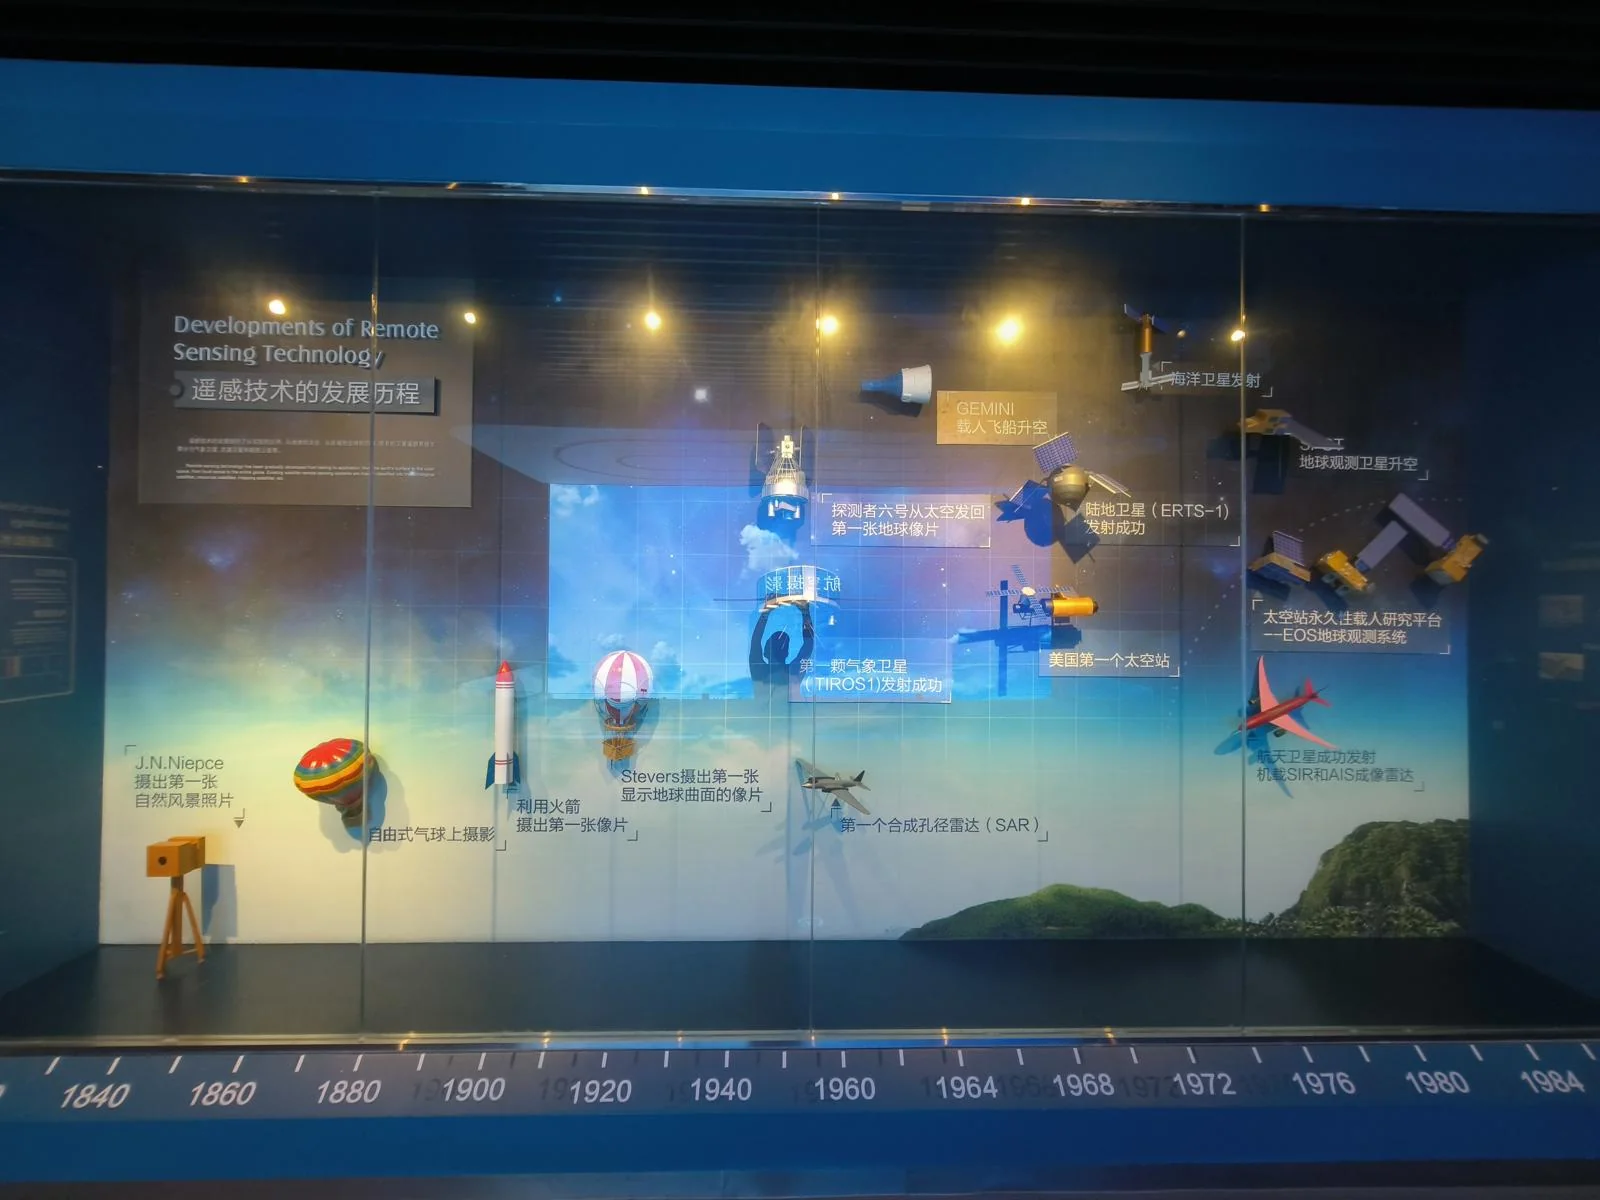
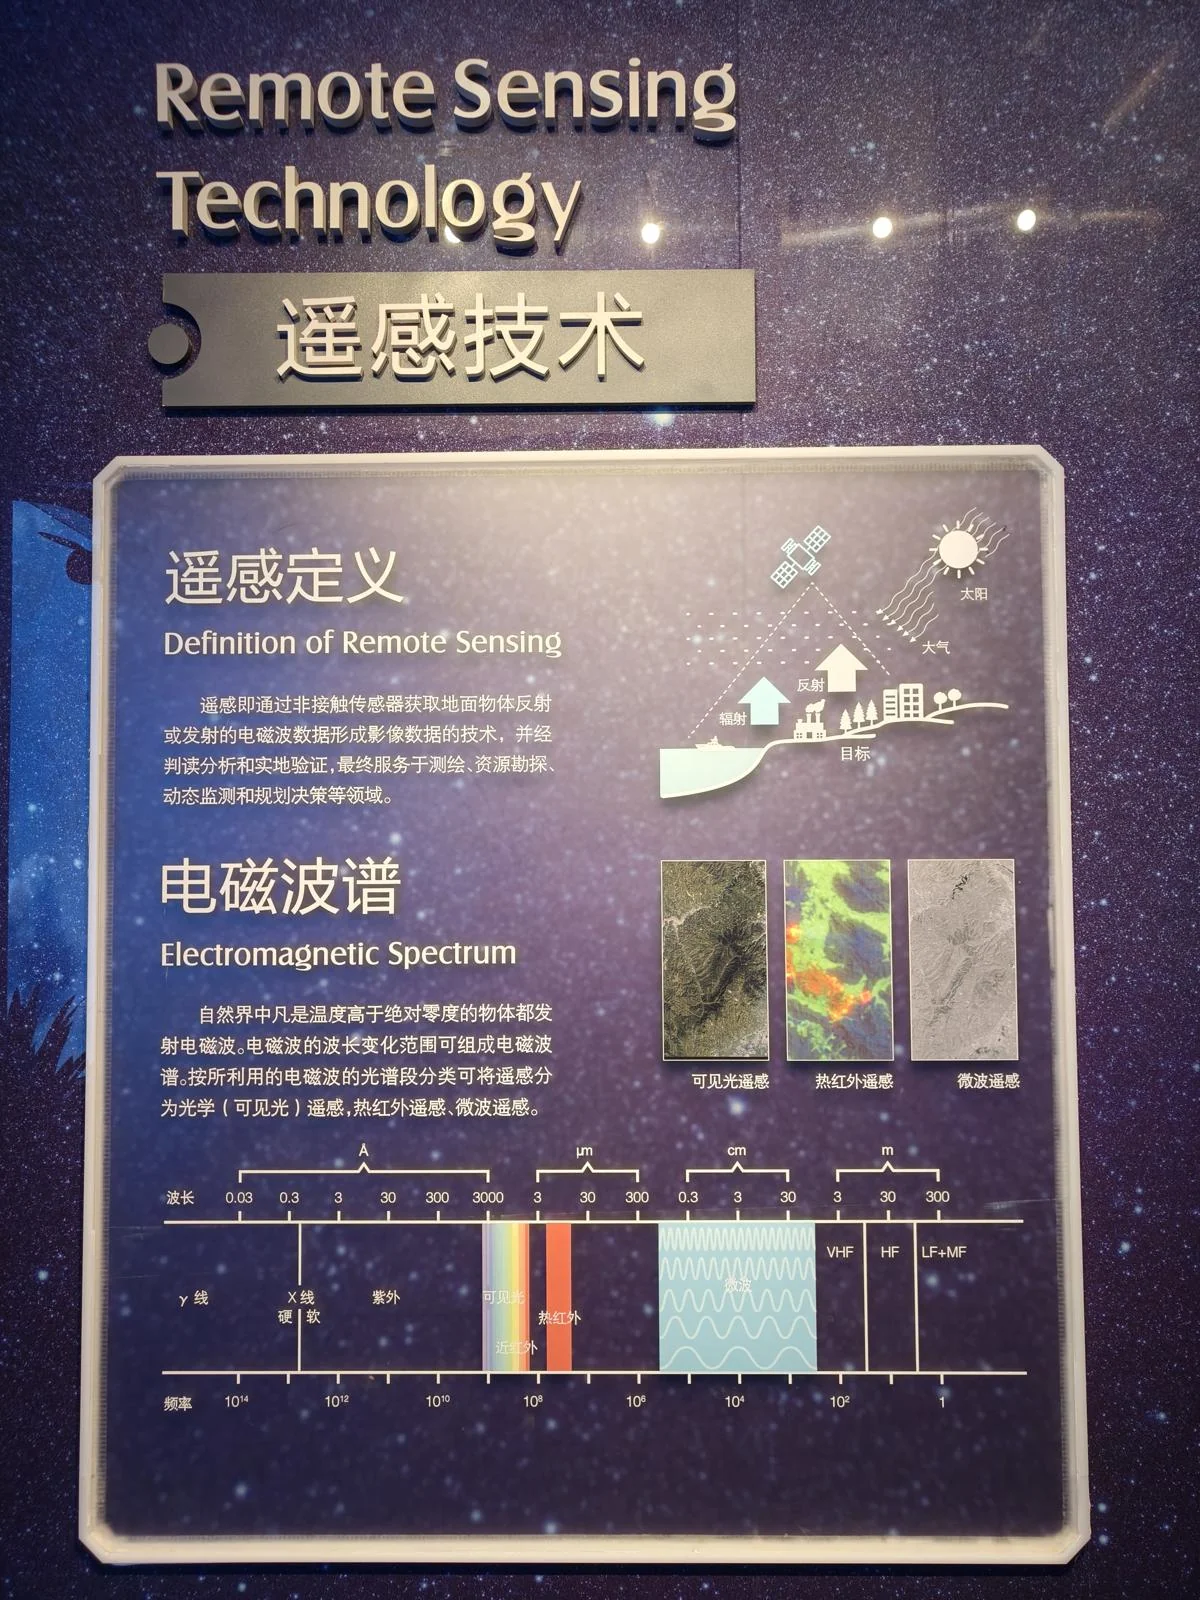
The history of remote sensing technology.
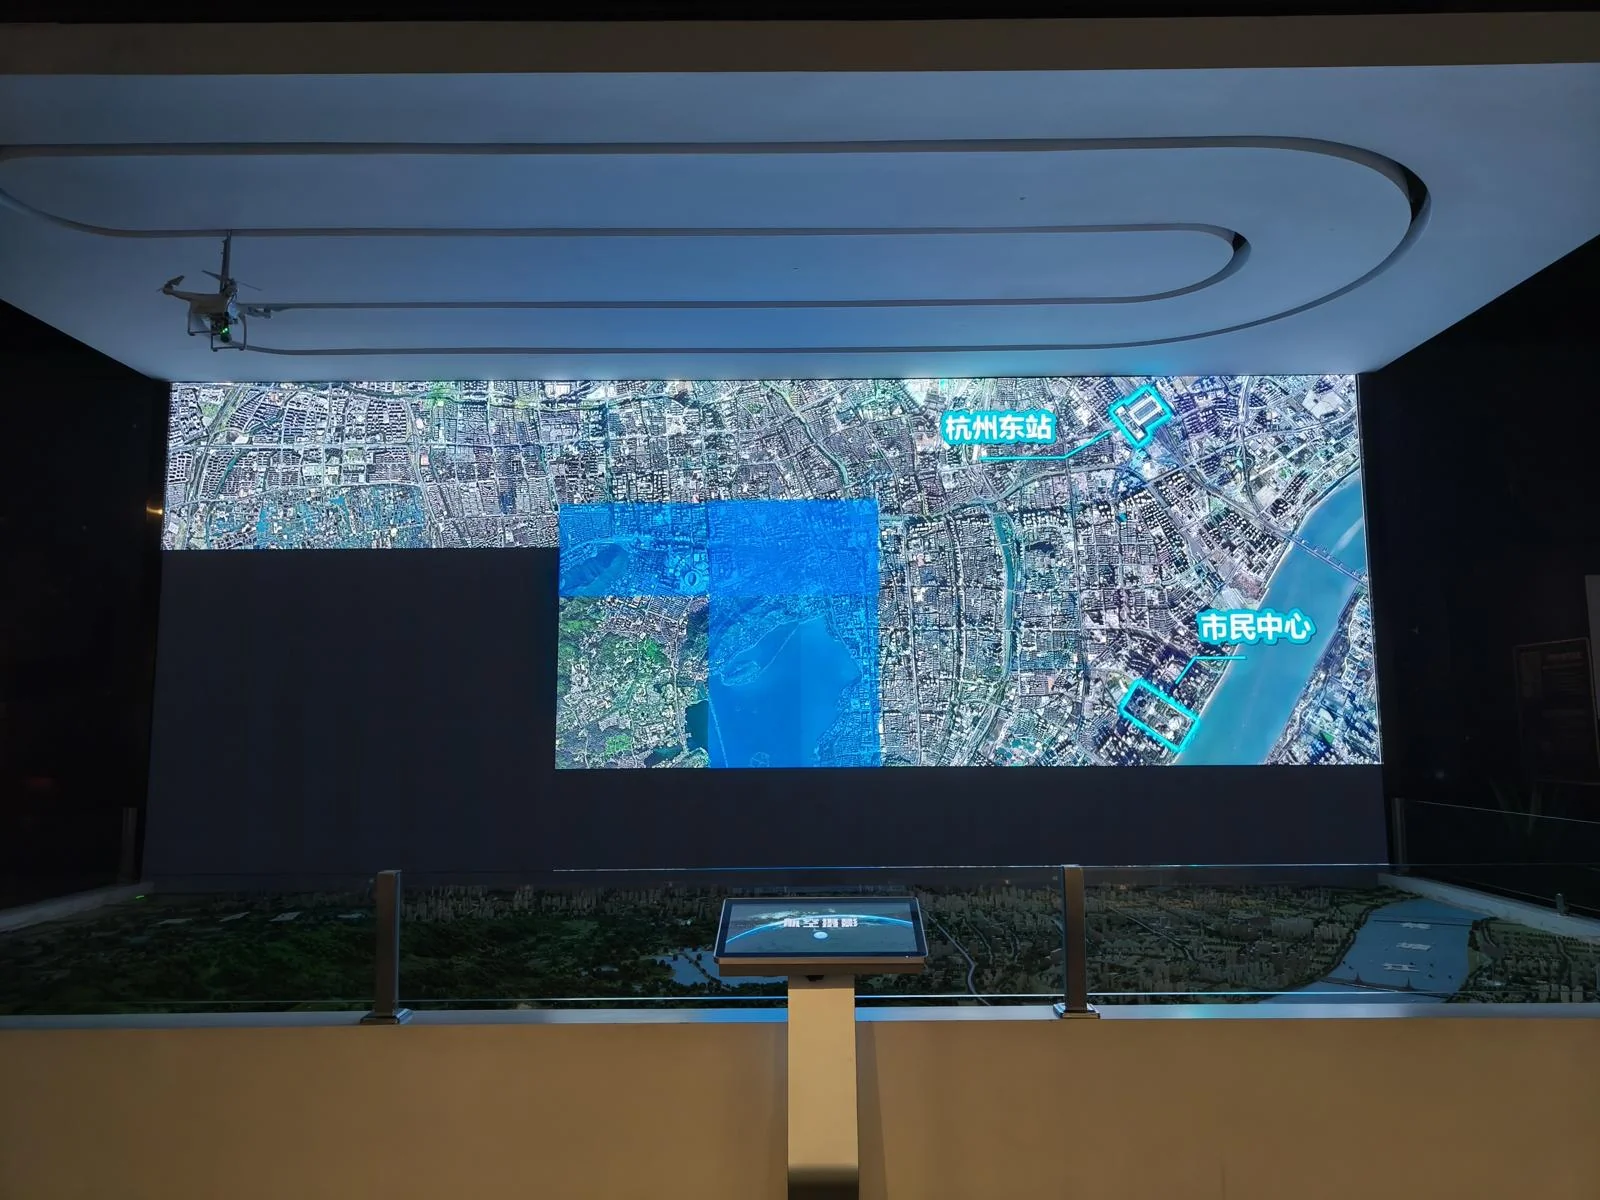
An interesting device showed how aerial drone photos of a city are stitched together. This is the same process used to create the satellite layer in map apps.
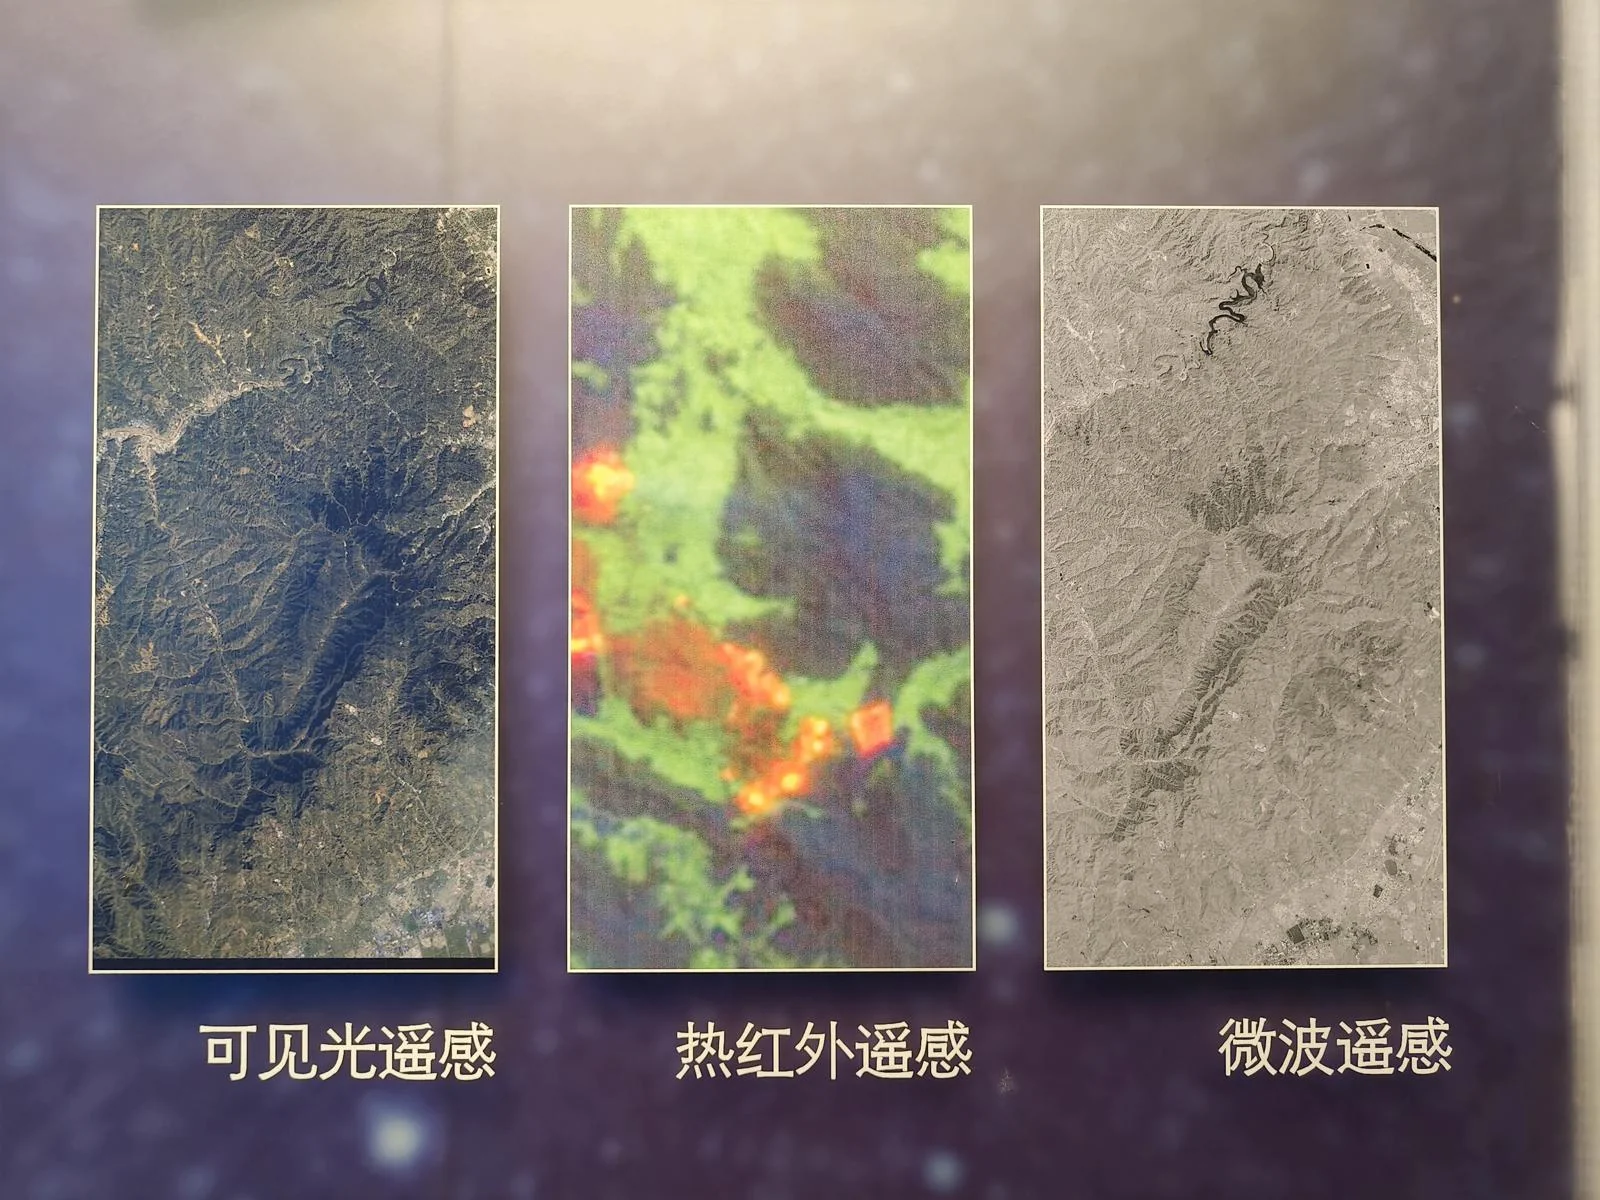
Remote sensing goes beyond visible light, using infrared, microwave, and other bands to gather richer information.
GIS Systems
This hall was a highlight, showcasing the true power of surveying technology. All the history and techniques discussed so far are about collecting data.
But are numbers and images the end goal? In data analysis, raw data is useless, no matter how much you have. It must be cleaned, processed, and integrated to derive meaning.
Similarly, scattered survey data must be integrated into a system to create a multi-dimensional reconstruction of our world. This is GIS: the Geographic Information System.
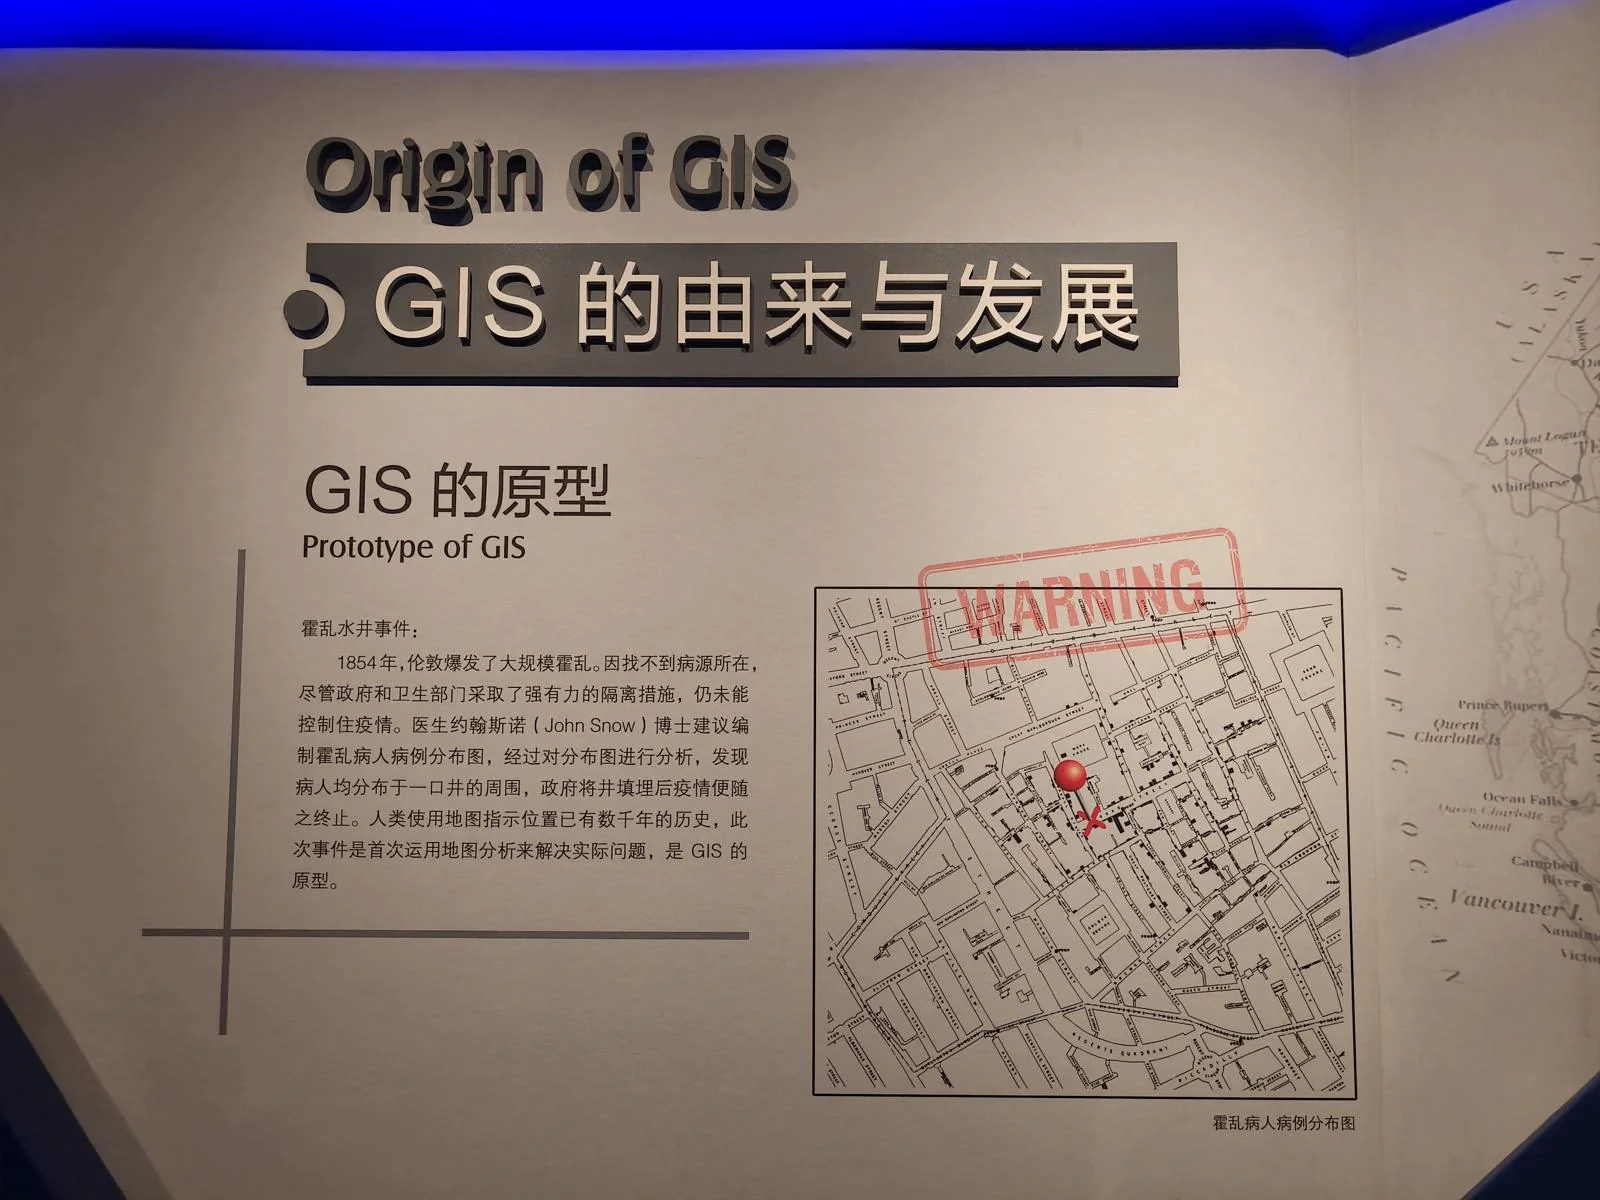
This board displays one of the earliest applications of GIS.
In mid-19th century London, during a cholera outbreak, Dr. John Snow (no, not that one) mapped the locations of cases. He noticed they clustered around a specific water pump, allowing him to identify and disable the source of the contamination.
This is a landmark case in the history of data analysis. I’ll recommend a documentary at the end that covers this story.
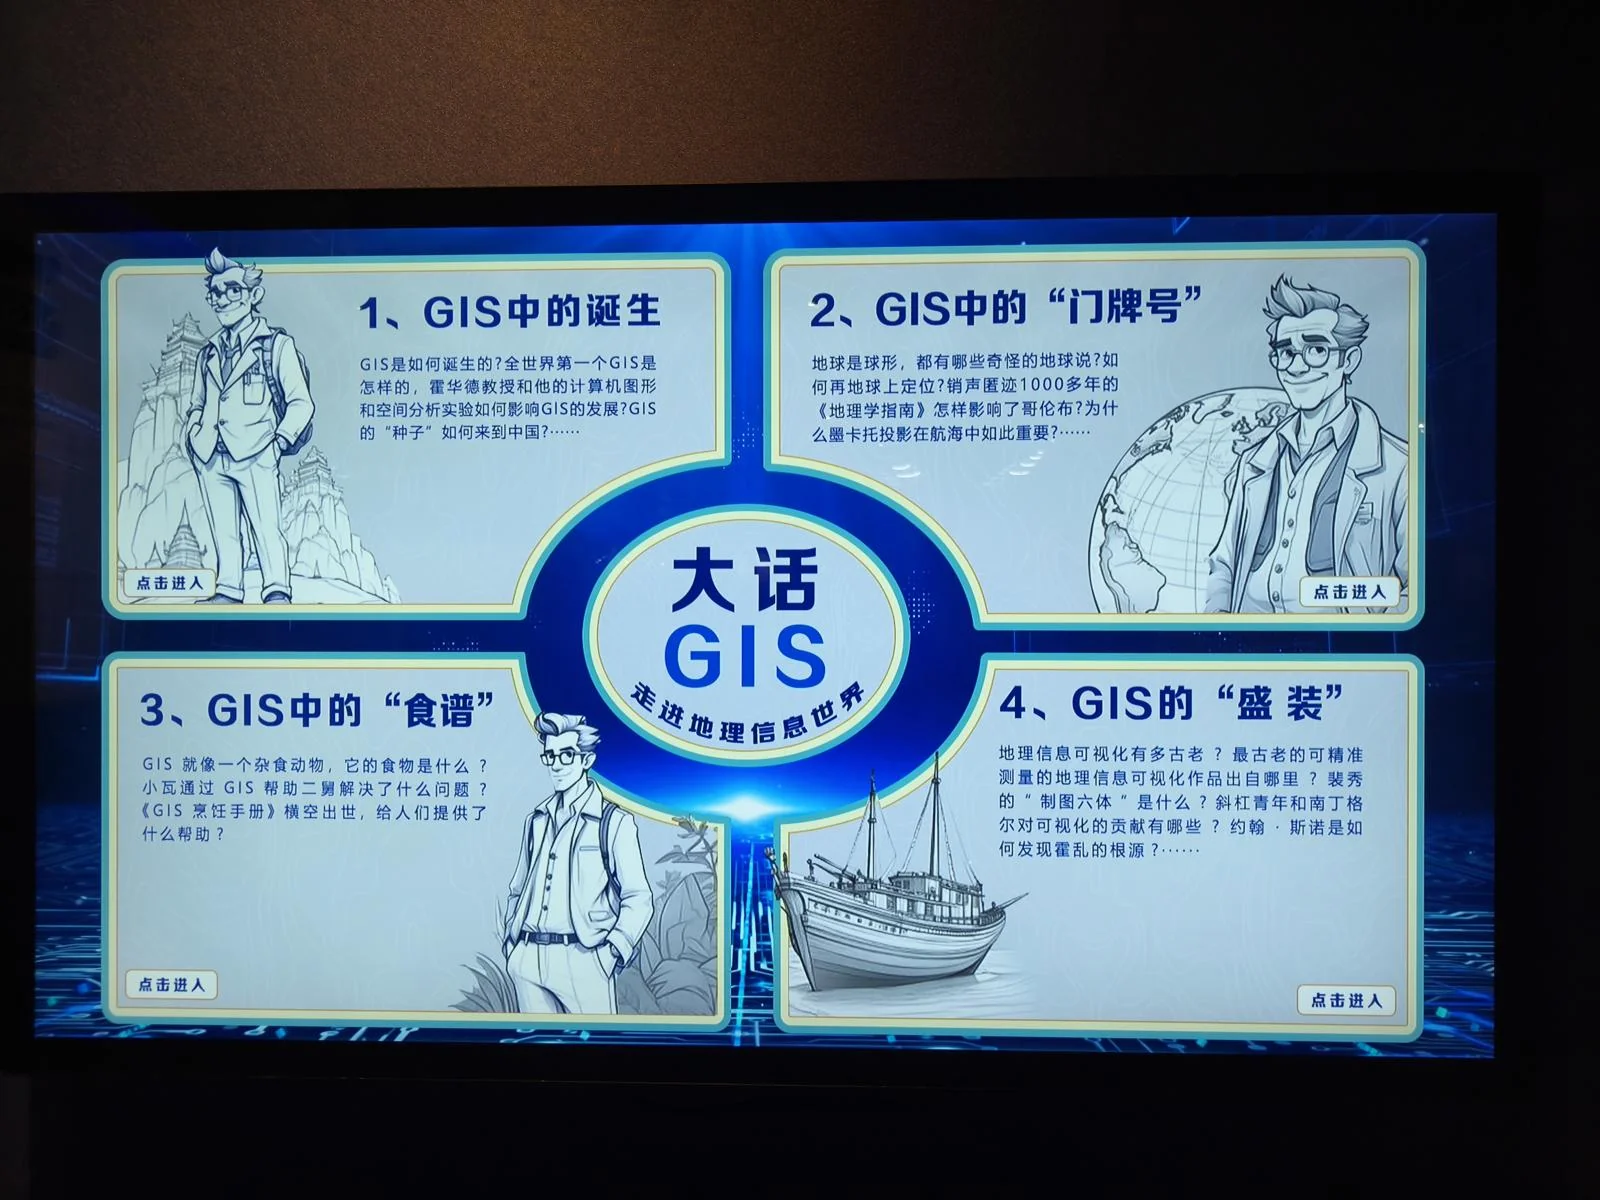
This interactive screen offered a complete introduction to GIS. I really wanted to explore it, but I’ll have to save that for next time.
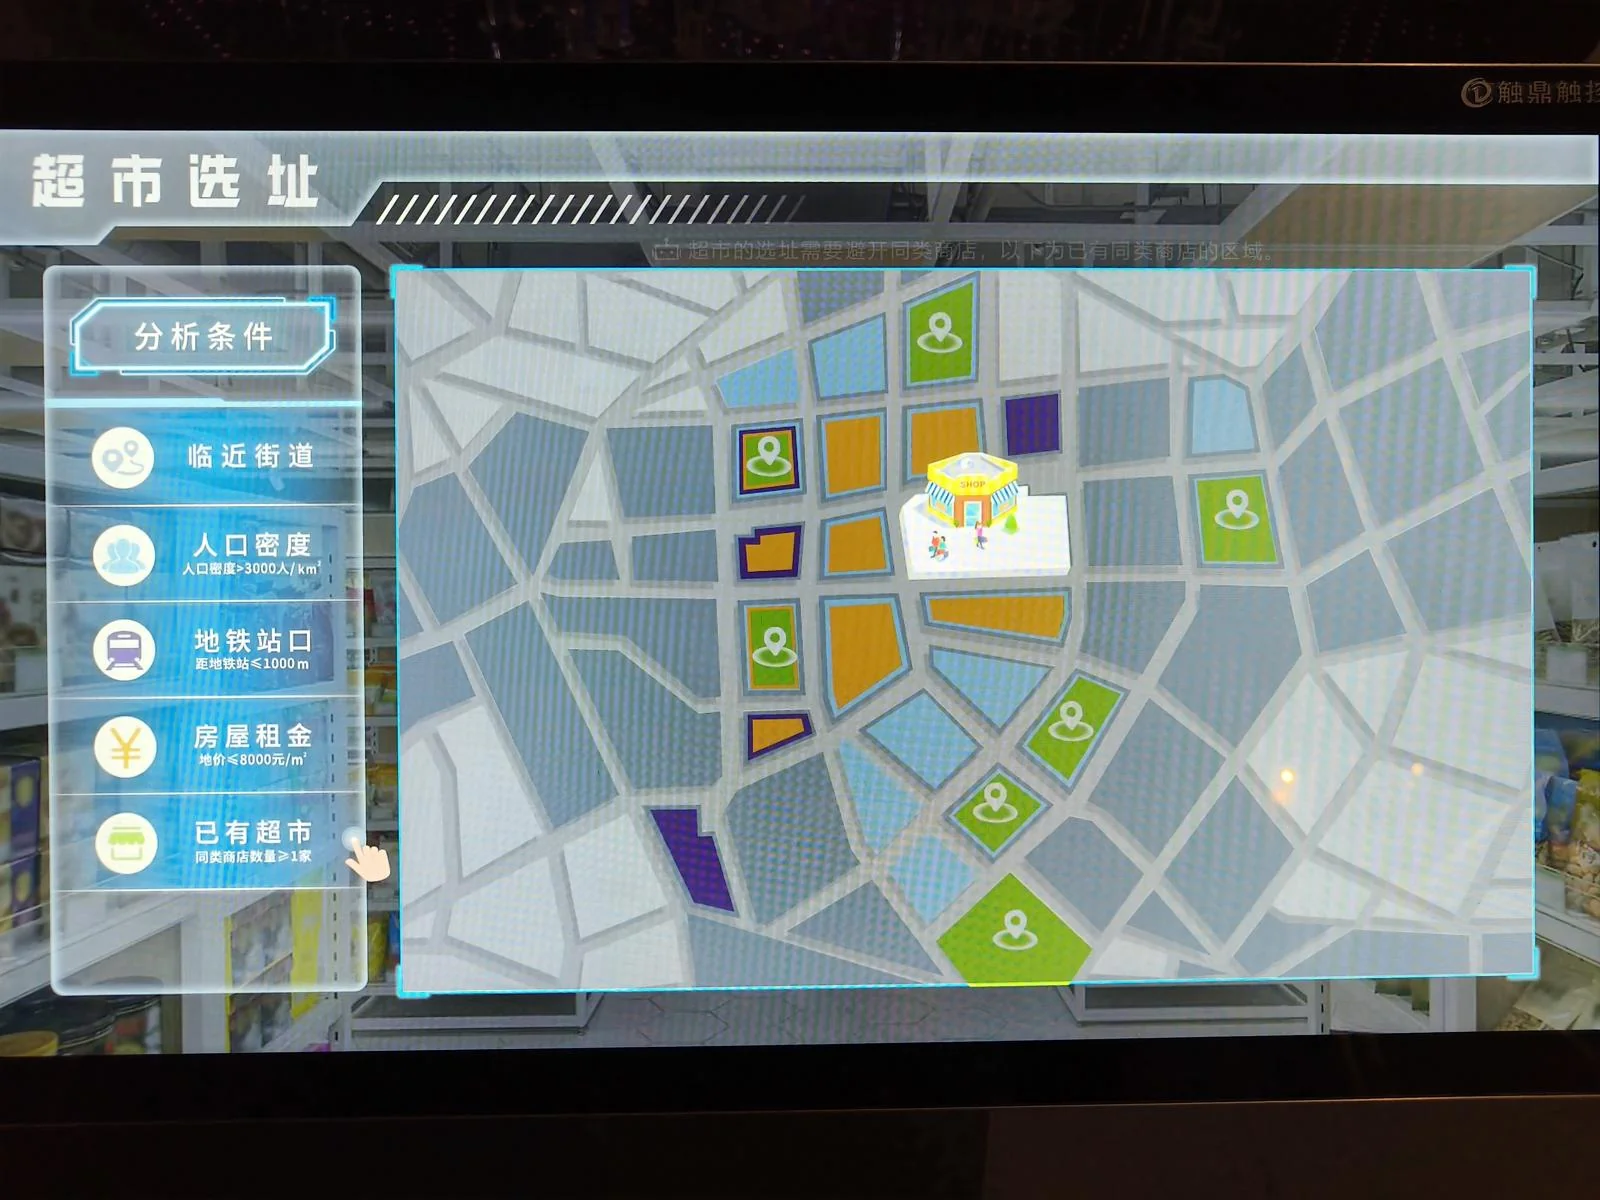
This installation demonstrated GIS for supermarket site selection. Imagine a city wants to build a new public-welfare supermarket. It needs to be on a main road, serve a large population, be near a transport hub, have reasonable rent, and avoid existing competitors. Following the steps, the device filters down to the optimal locations.
Only by integrating data on road networks, population, transport hubs, land prices, and property types can such an analysis be performed. This highlights the unique power of GIS.

There was also a racing game I didn’t try. I’m not sure what aspect of GIS it demonstrated, but it seemed popular with kids—it’s all over Xiaohongshu (Little Red Book) posts about the museum.
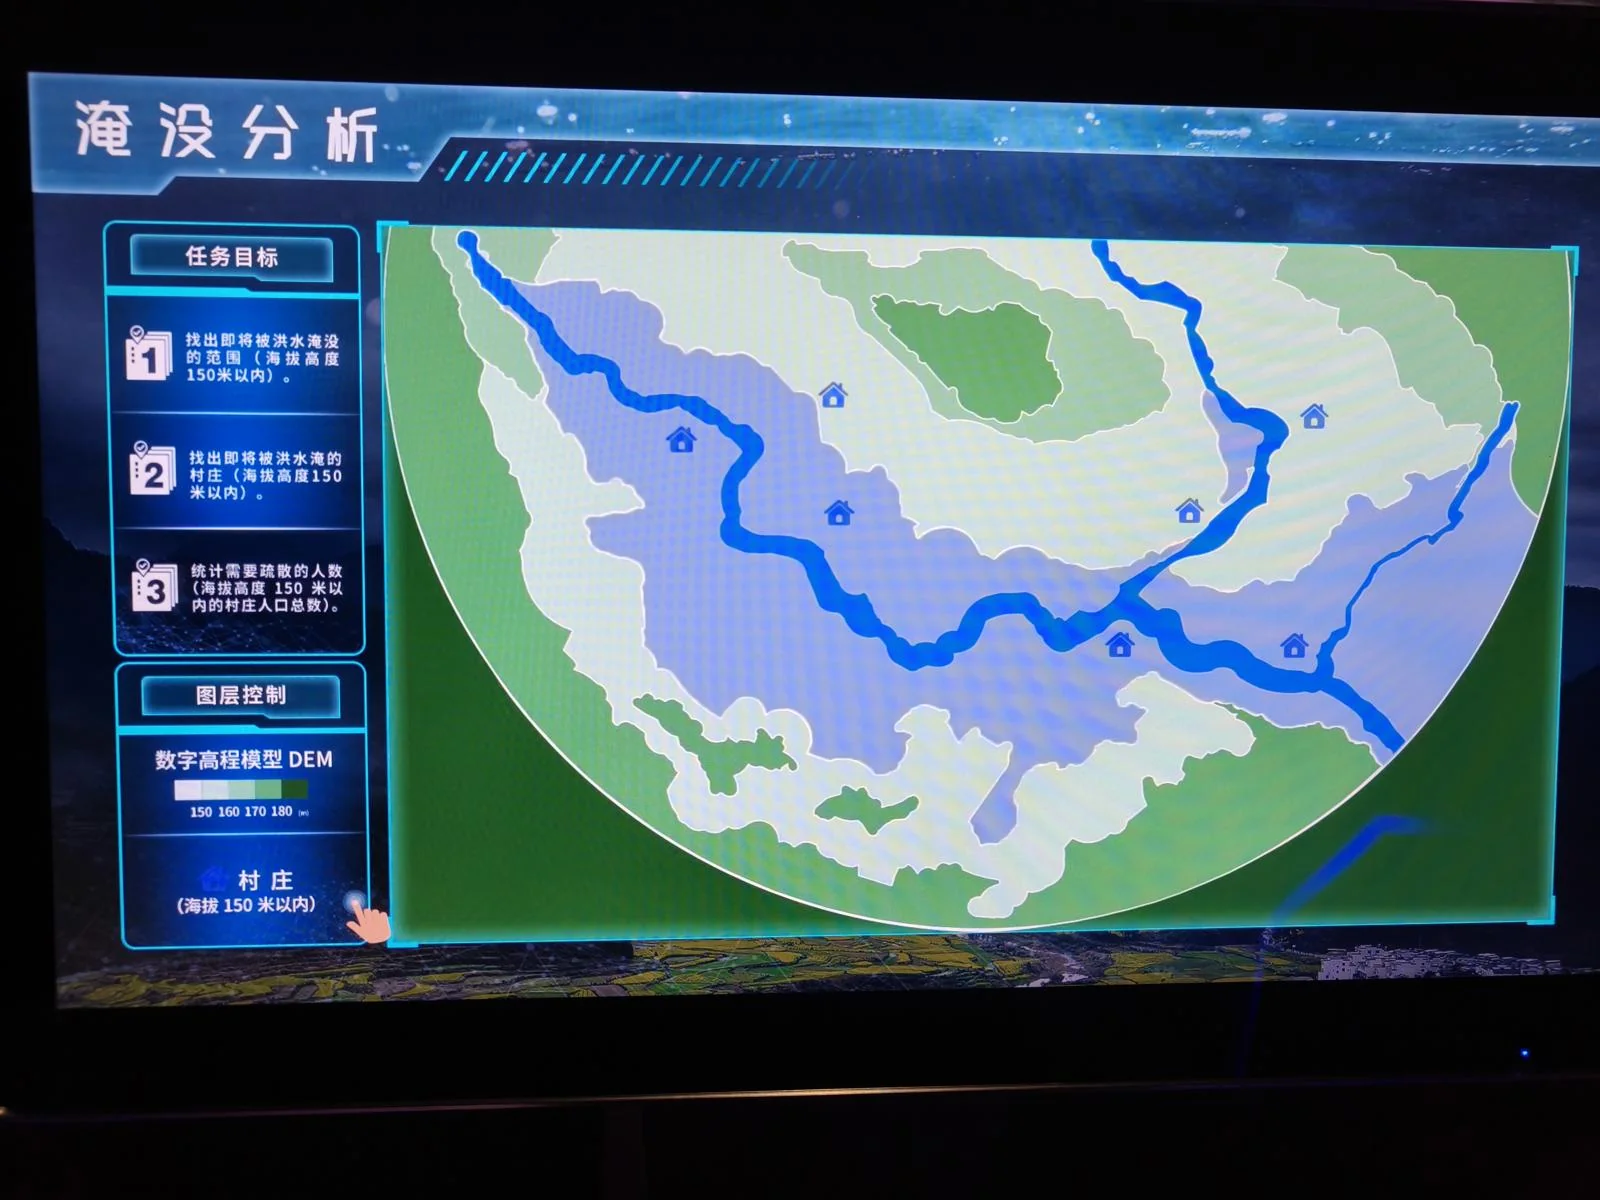
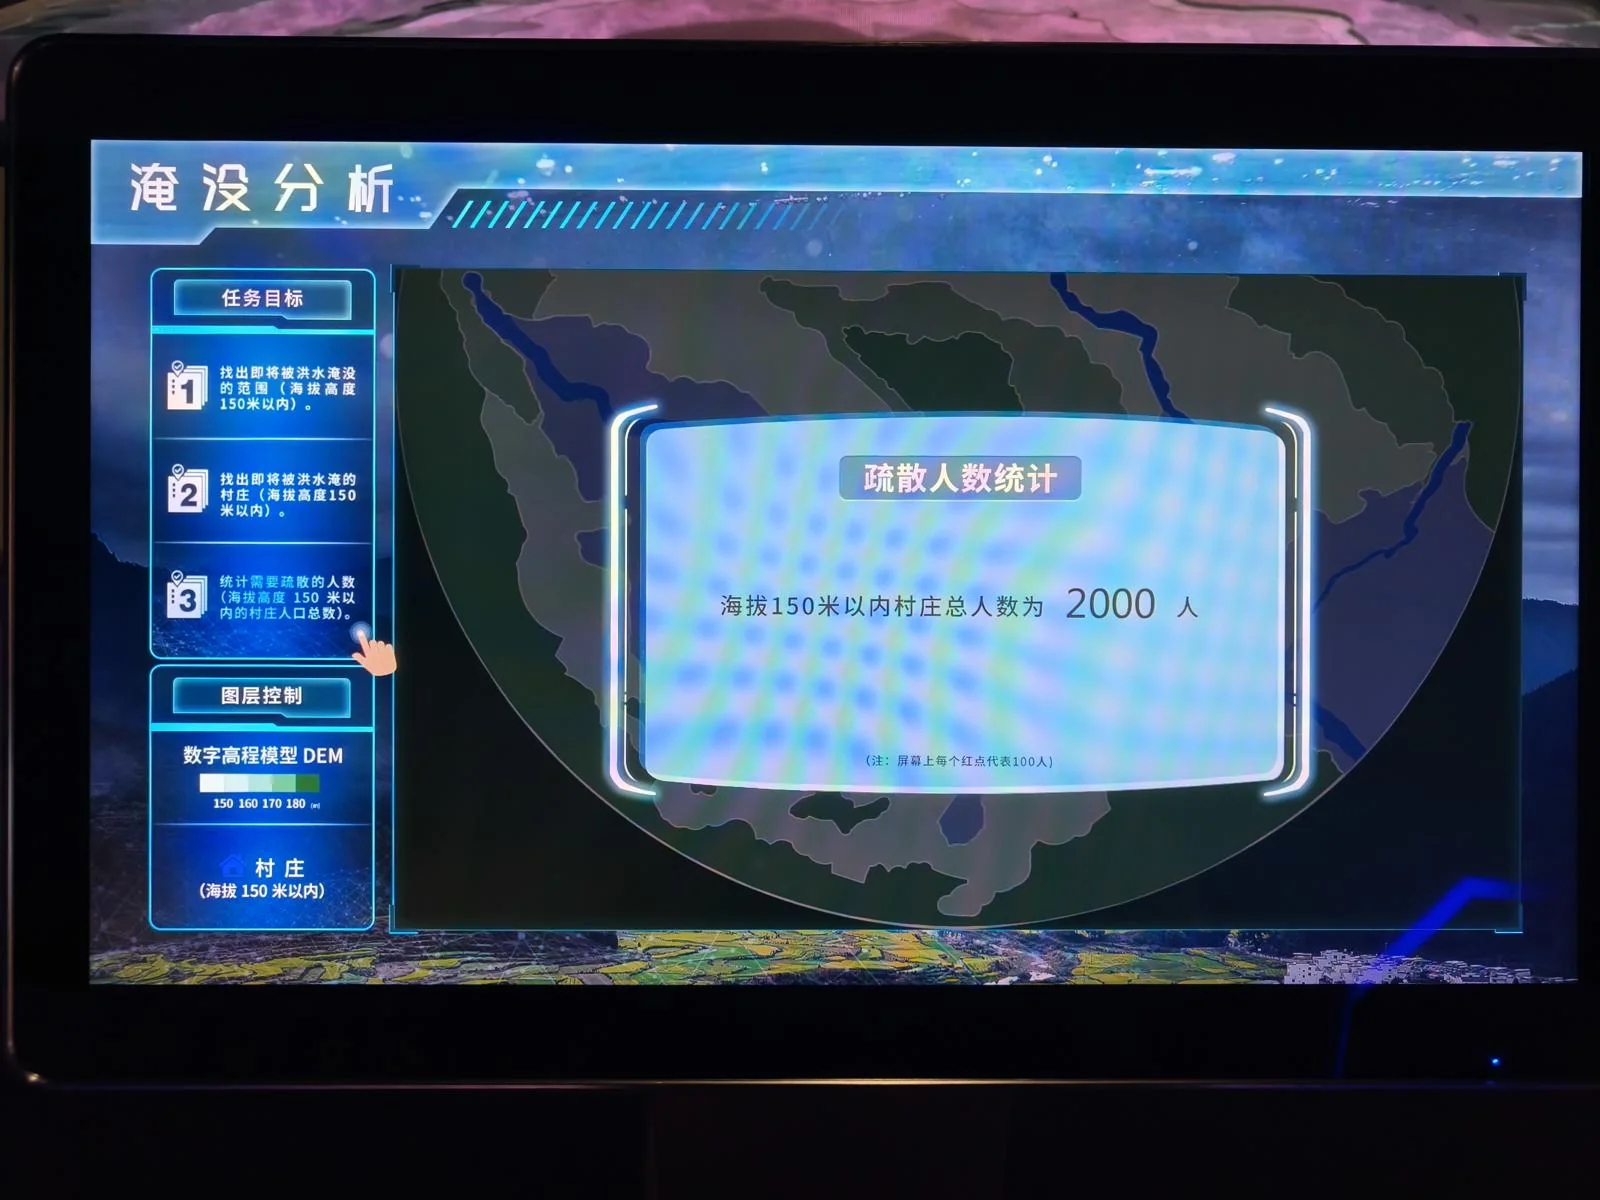
This flood inundation analysis tool demonstrates a value far greater than site selection. It simulates a river basin flood, allowing for rapid assessment of which villages will be affected, enabling time-critical evacuation decisions.
When we see disaster relief news, we see frontline responders and strategic command centers. But behind their rapid response is a robust geographic information database.
A nation’s strength is highly correlated with its level of informatization. National power is the ability to mobilize resources, and data’s role in that is ever-growing.
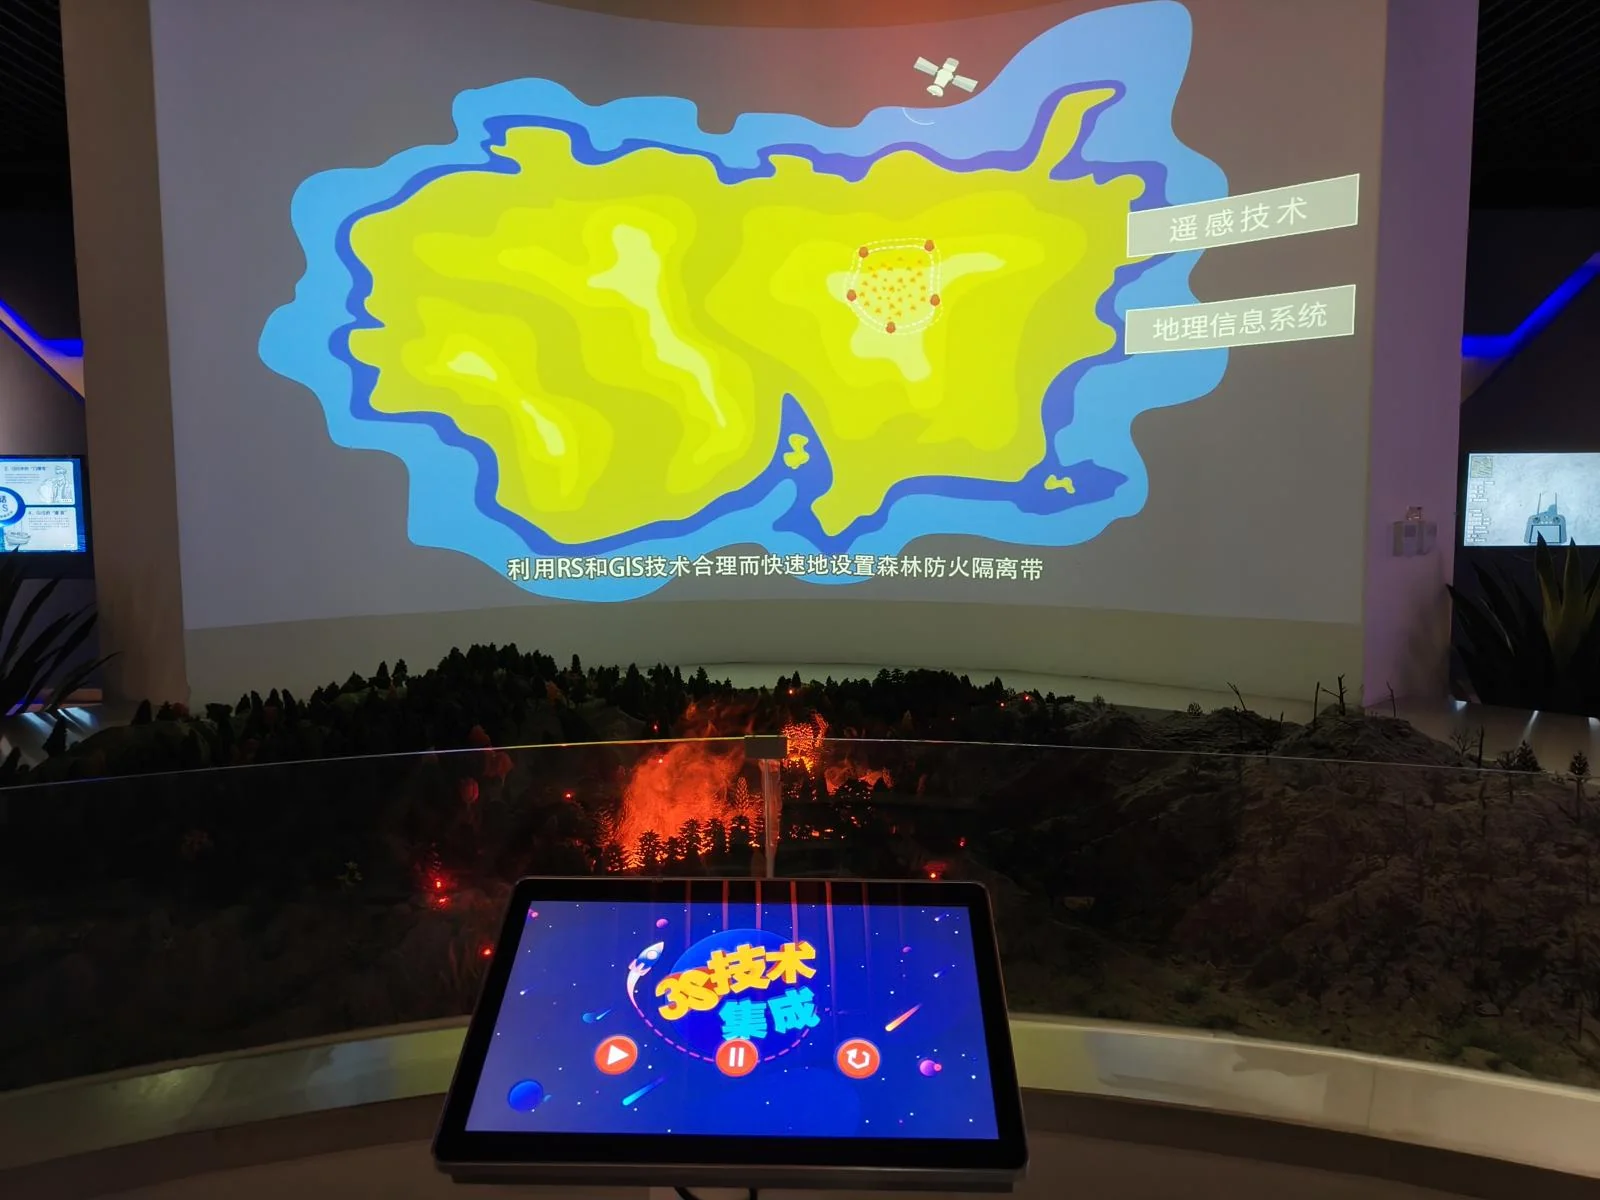
This installation showed how remote sensing technology helps fight forest fires.
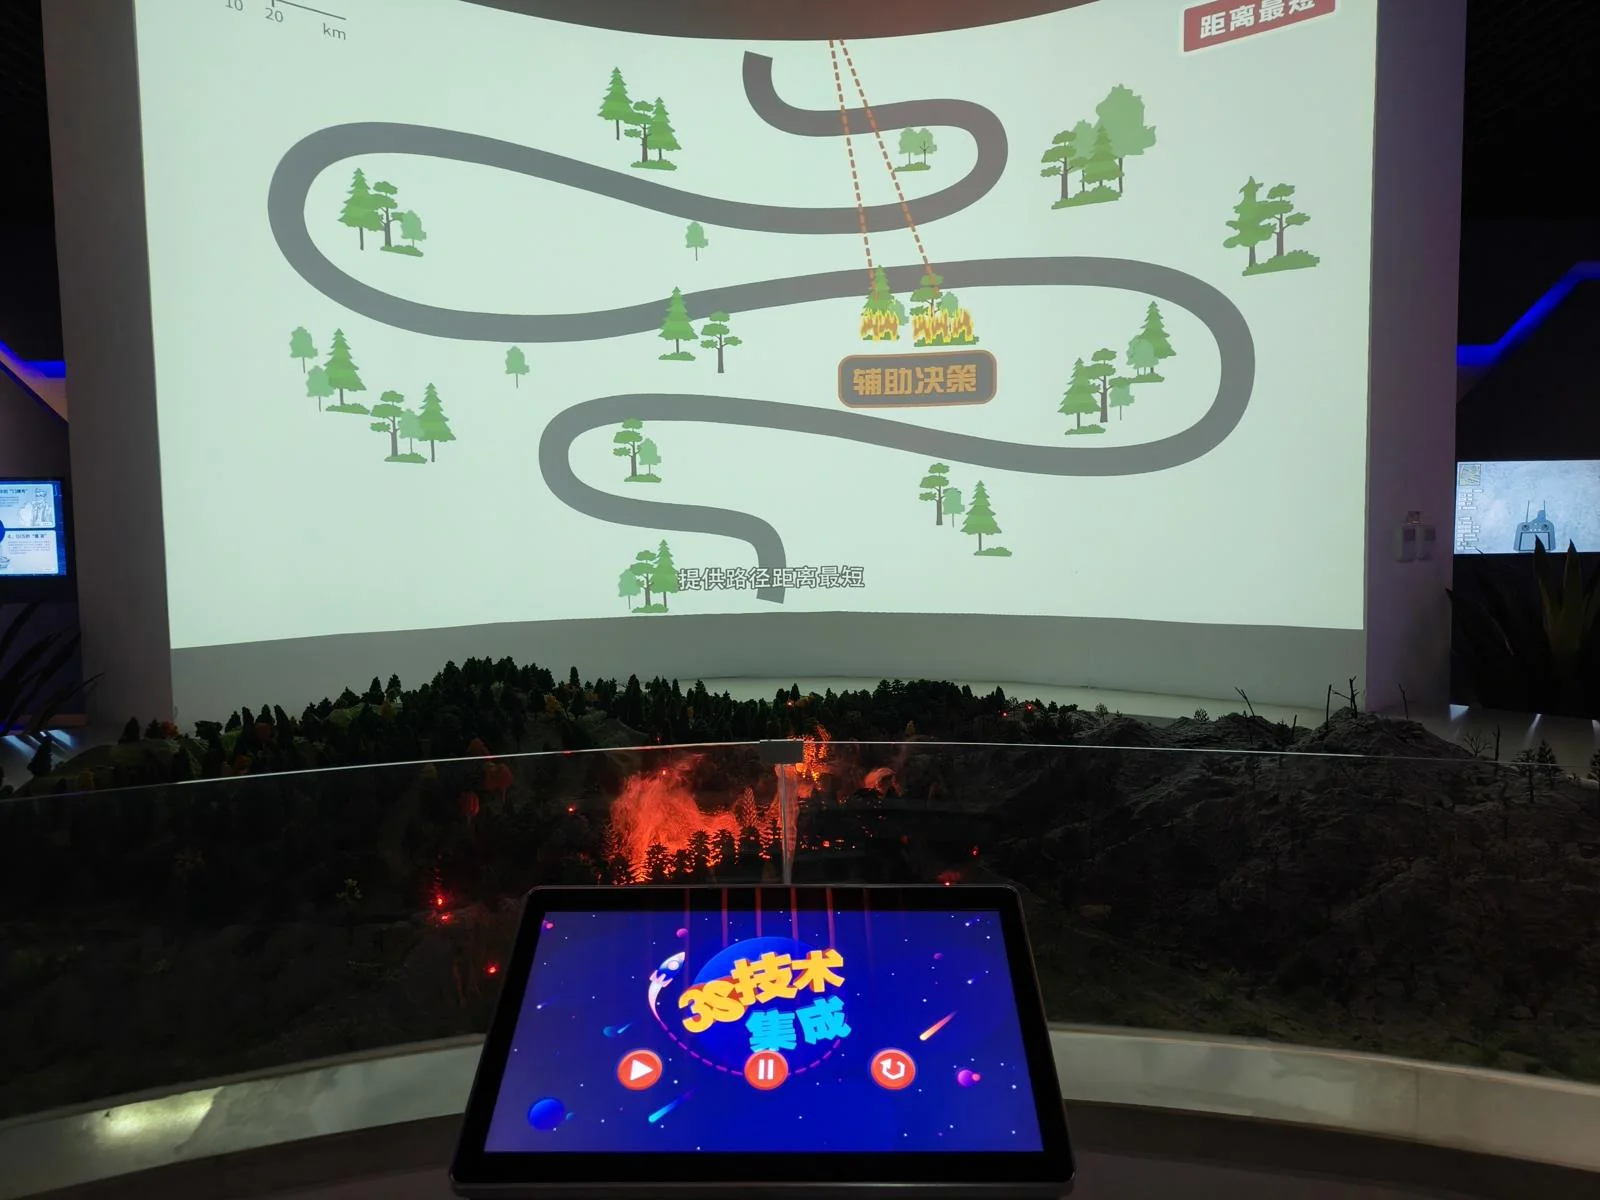
Manual or automated analysis of fire imagery provides crucial, real-time intelligence for firefighting efforts and helps predict a fire’s spread.
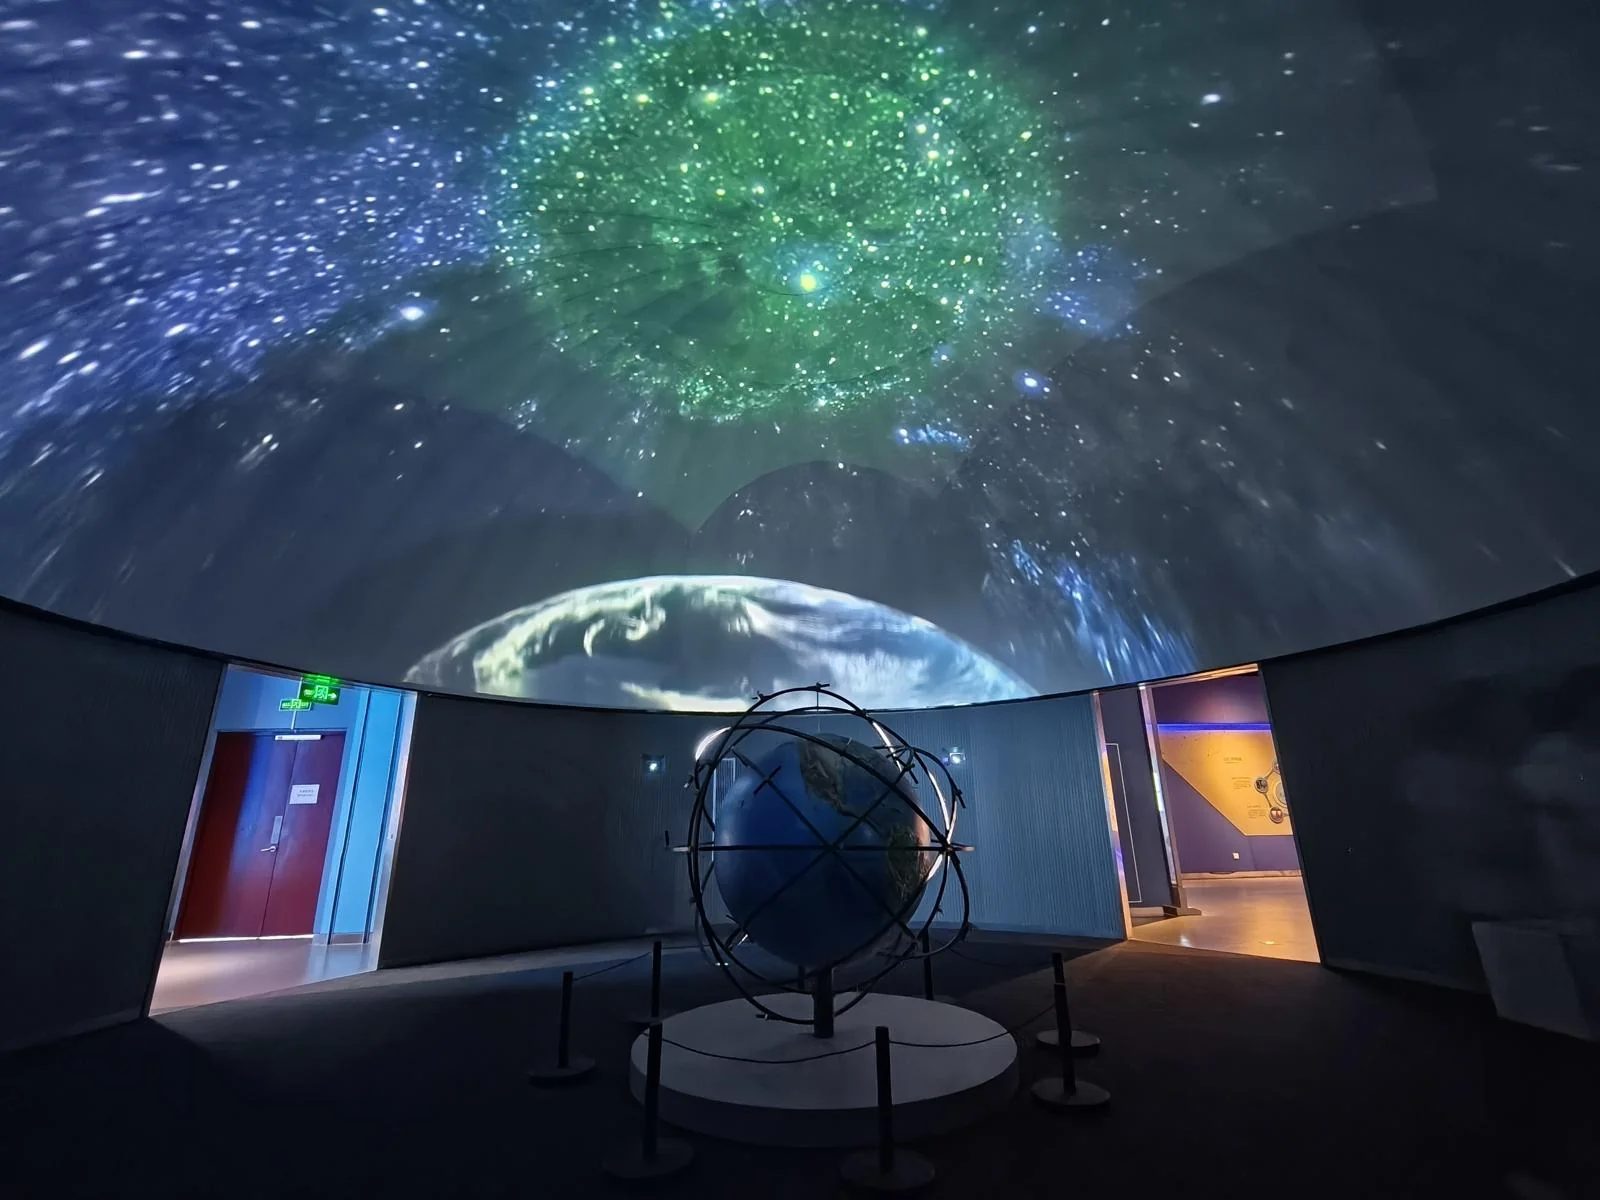
Next, I passed through a dome theater. I caught the 10:40 AM show, a 5-minute film about the BeiDou Navigation Satellite System. Unfortunately, it didn’t make great use of the dome format; it felt more like a regular video projected on a curved screen.
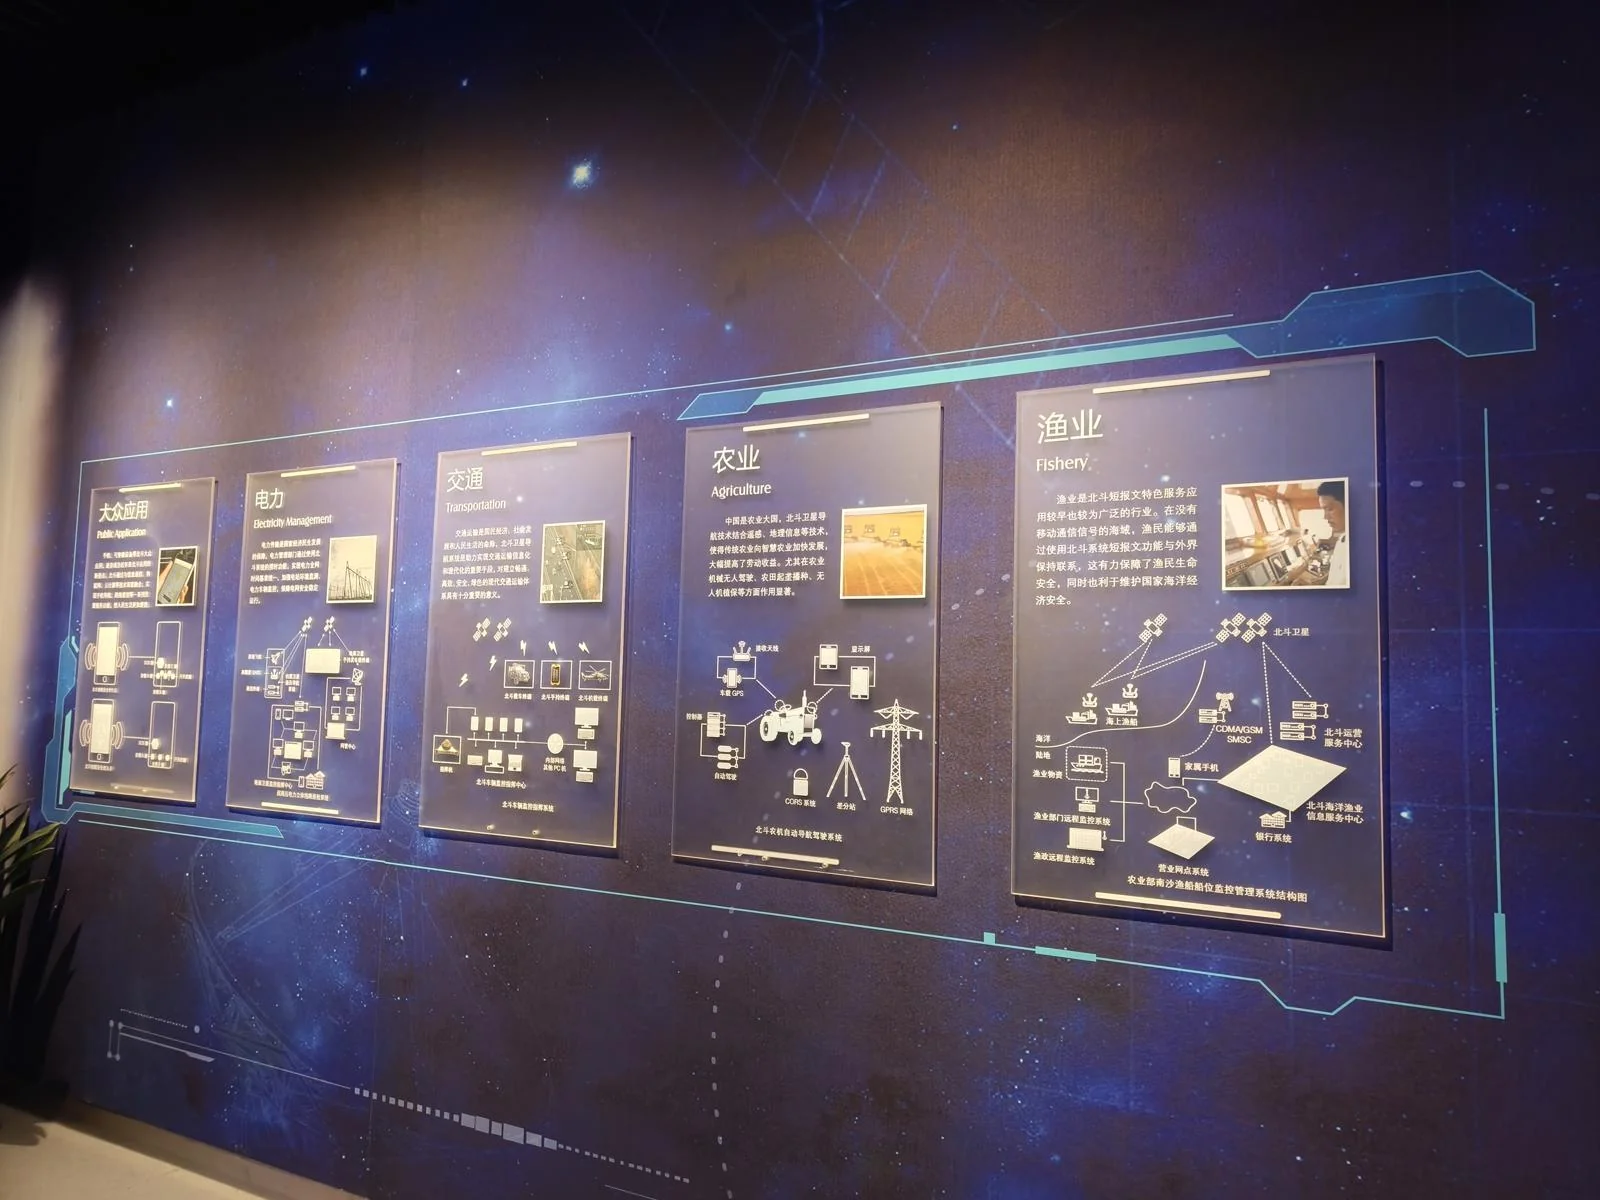
This series of panels showed macro-level applications of GIS in public life.
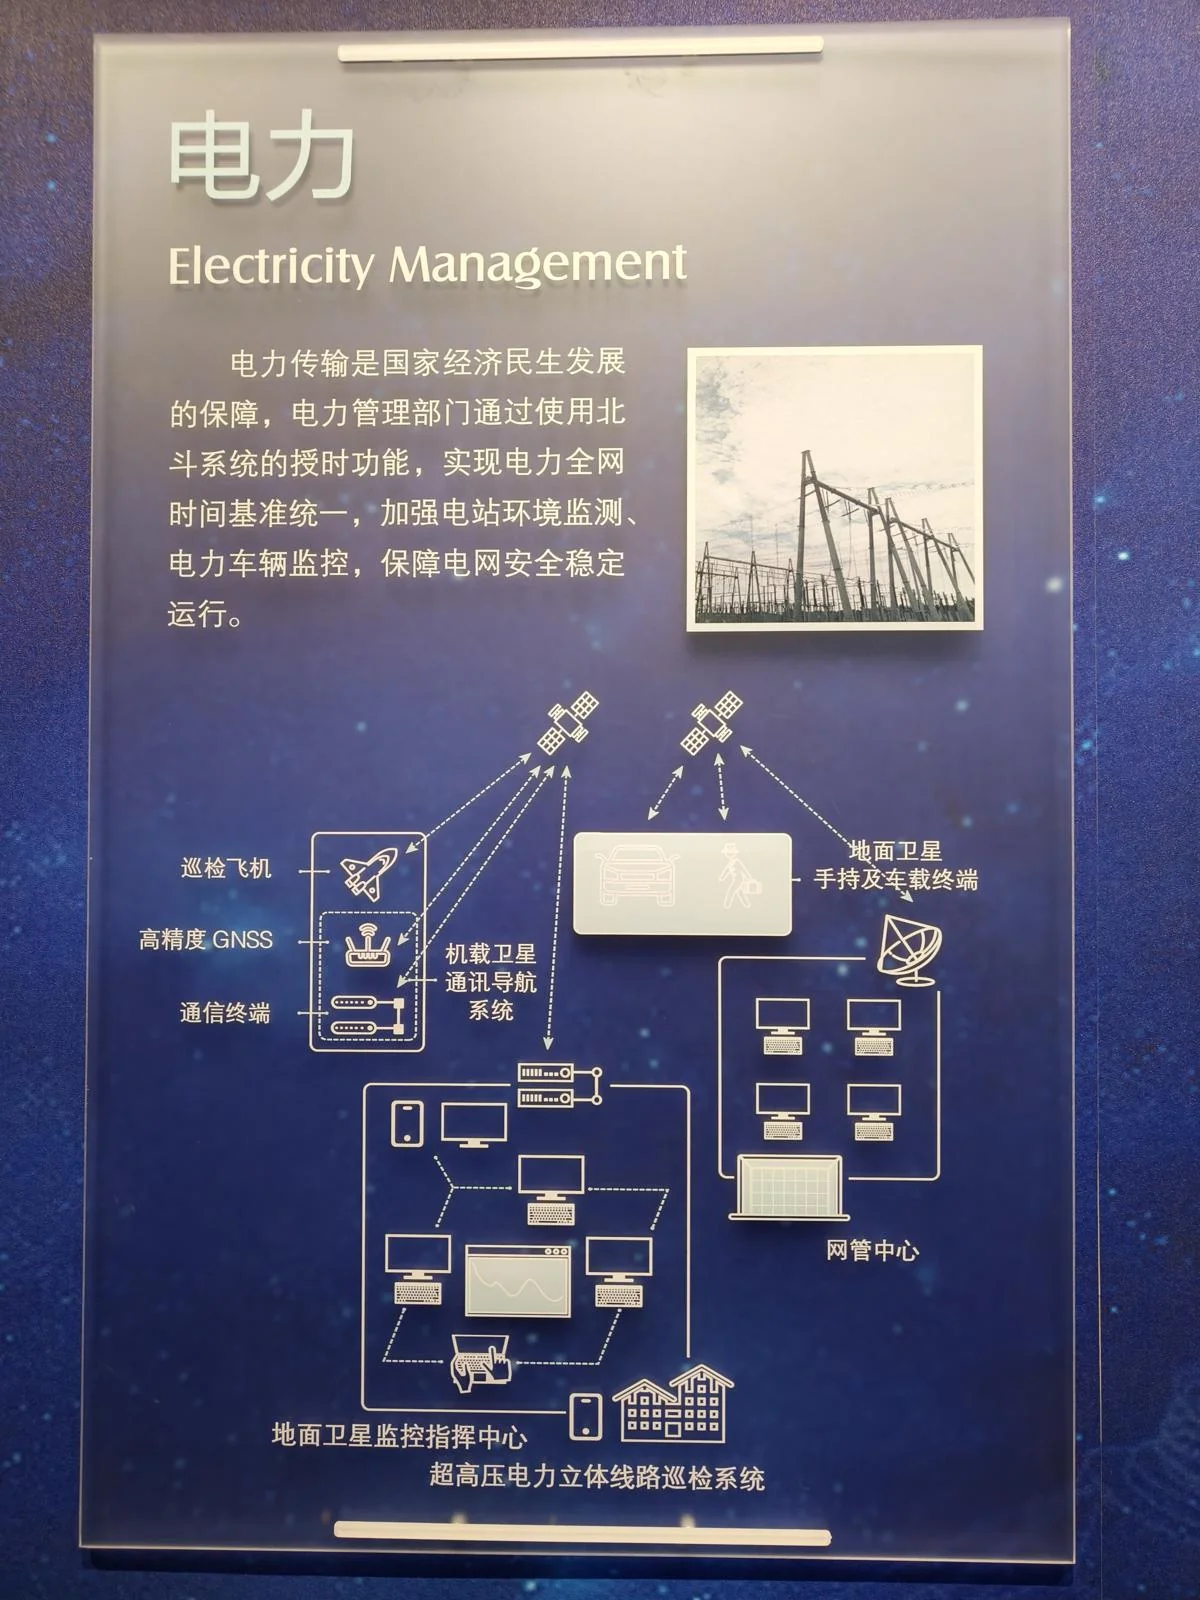
The role of GIS in the power grid can be abstract, so let me explain.
We take for granted that electricity is always there when we flip a switch. But when you turn on an air conditioner, where does that extra power come from?
At the other end of the grid, a natural gas plant might ramp up its output slightly. Or a solar farm might discharge a bit from its battery storage.
Electricity travels at near light speed. The moment you turn on your AC, it needs that power. How does the plant know?
This is the incredible challenge of a national power grid. The grid must constantly predict load changes and dispatch flexible power sources (hydro, gas, batteries) to match demand in real-time.
What if supply and demand don’t match? The entire grid and all its connected equipment must operate at a precise AC frequency. A significant mismatch causes the frequency to drift, which damages equipment. Damaged equipment destabilizes the frequency further, creating a vicious cycle that can lead to a nationwide blackout.
Therefore, the grid must predict and react to demand changes almost instantly, automatically dispatching power plants. This instantaneous response requires perfect time synchronization across the entire system.
This is where GIS plays a vital, life-or-death role: providing that precise time synchronization.
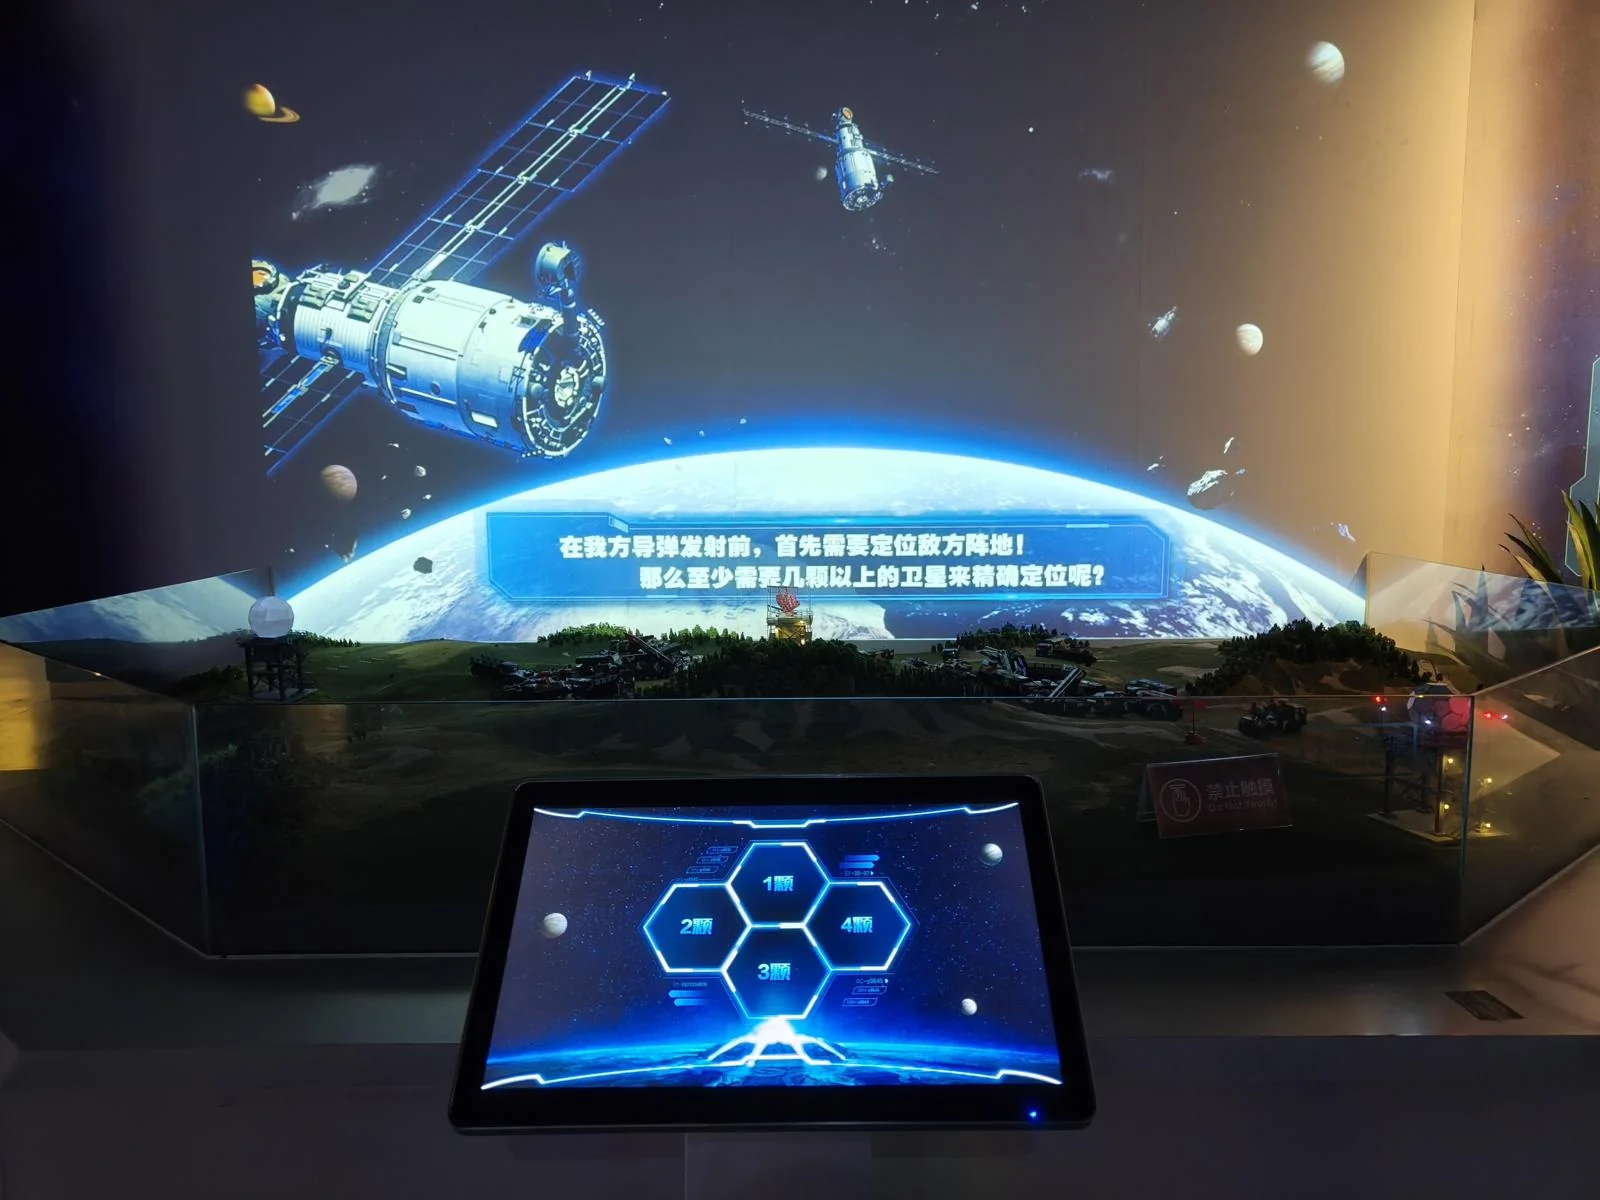
This installation simulated a military application of GIS: using satellite positioning to direct missile strikes.
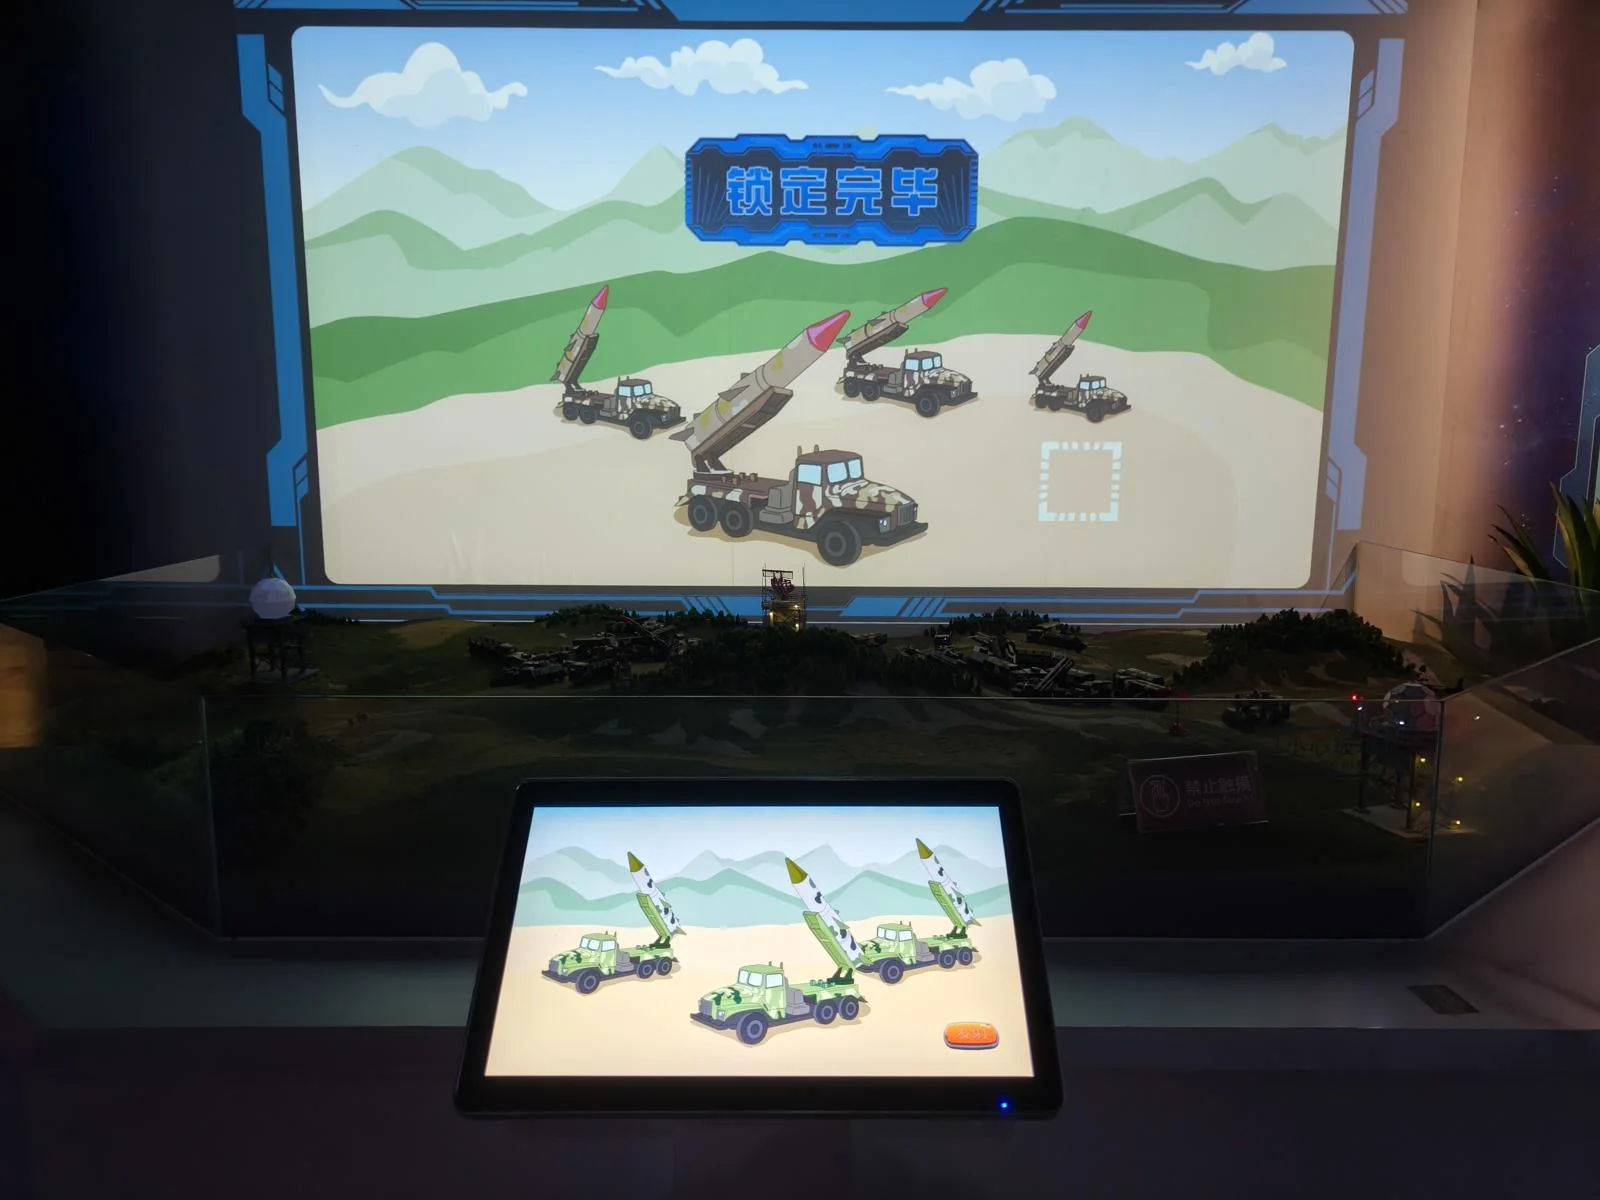
Target locked. I hit the launch button and slipped away to the next exhibit. Heroes in movies always walk away from explosions without looking back, right? 😉
The Story of Maps
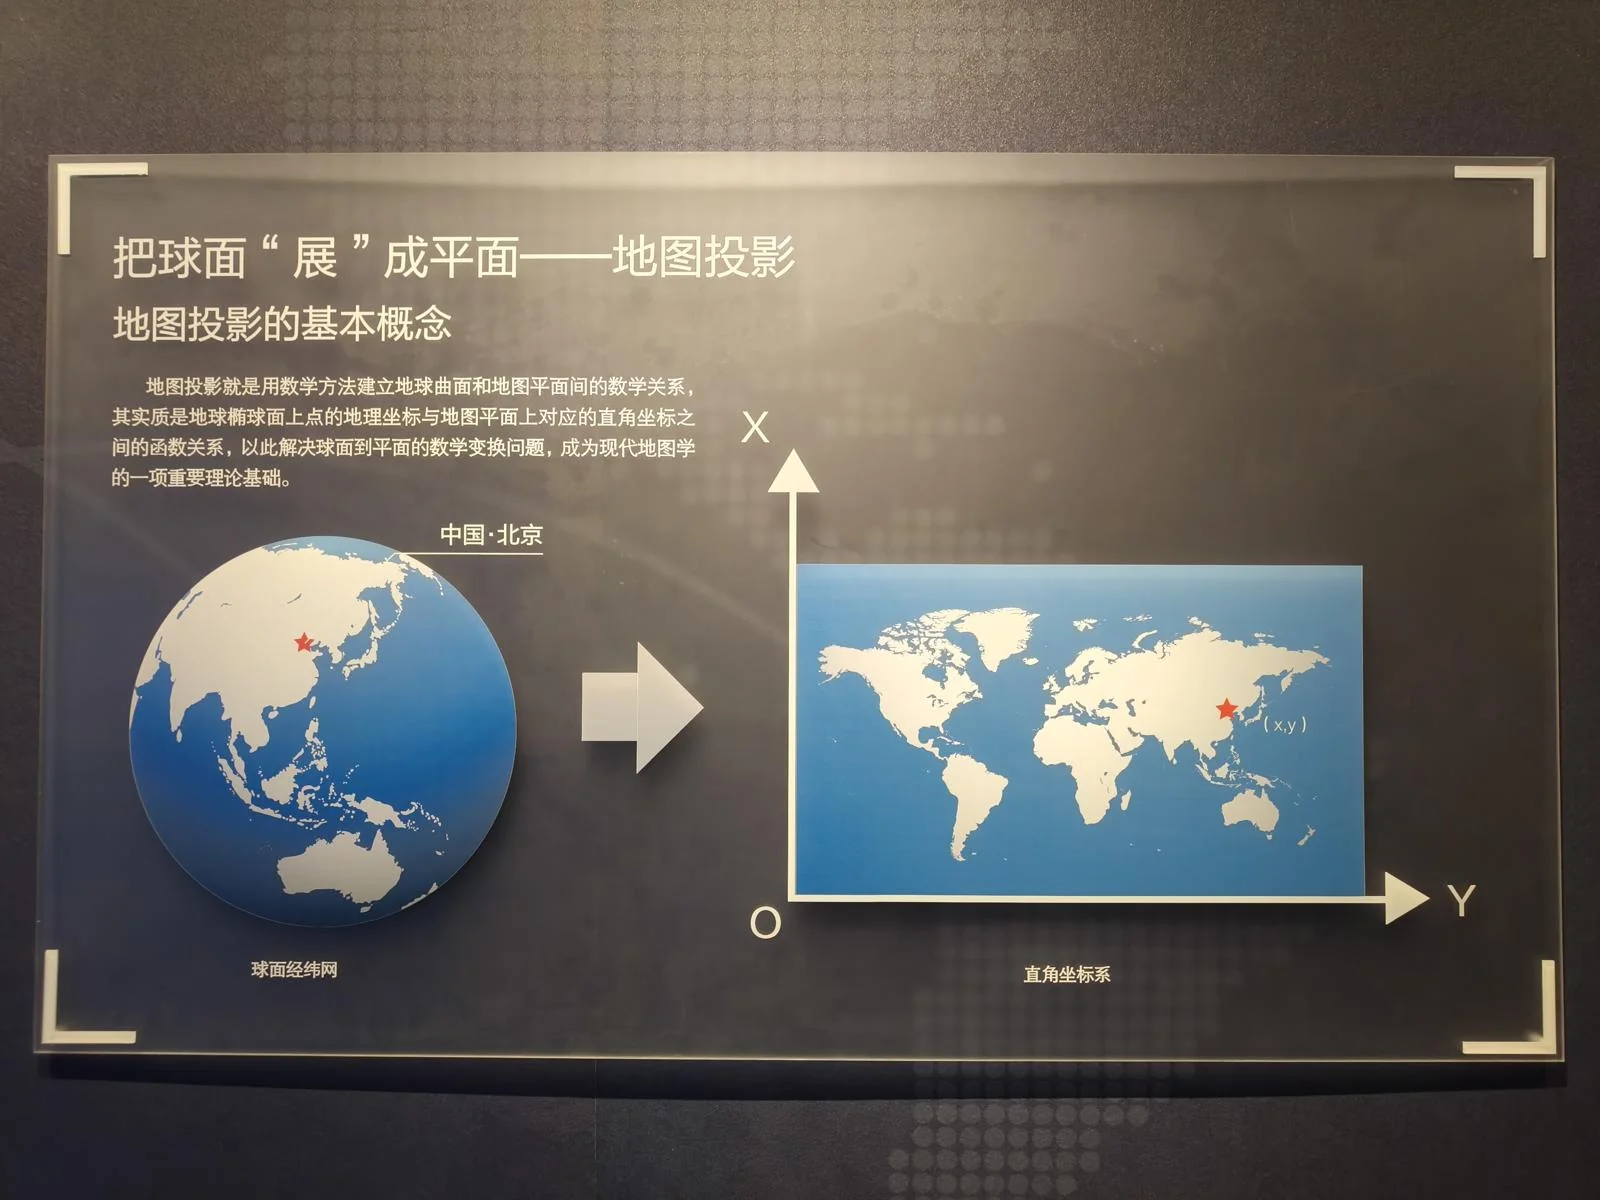
The last hall on the second floor was dedicated to maps, the product of all this surveying. “Viewing the world on a tiny square”—the phrase perfectly captures the essence of a map.
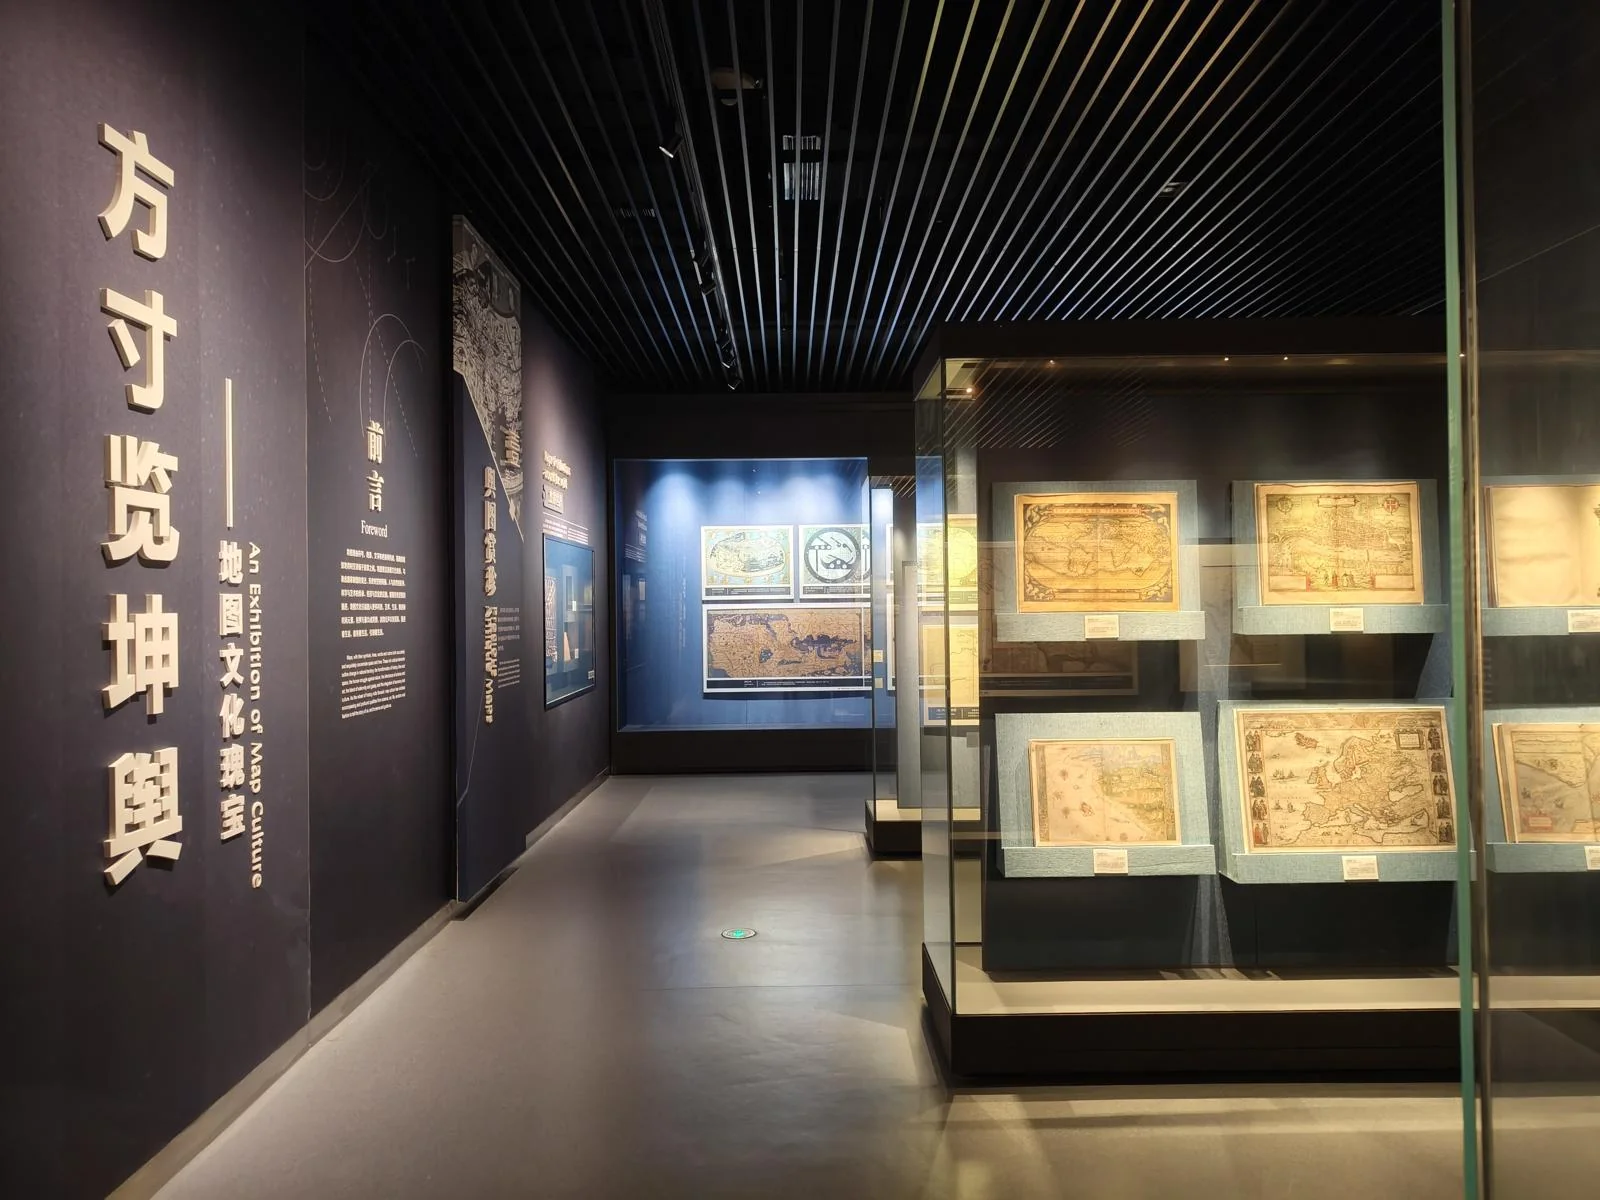
Entering the hall, I was greeted by a stunning collection of rare ancient maps—a paradise for any map lover.
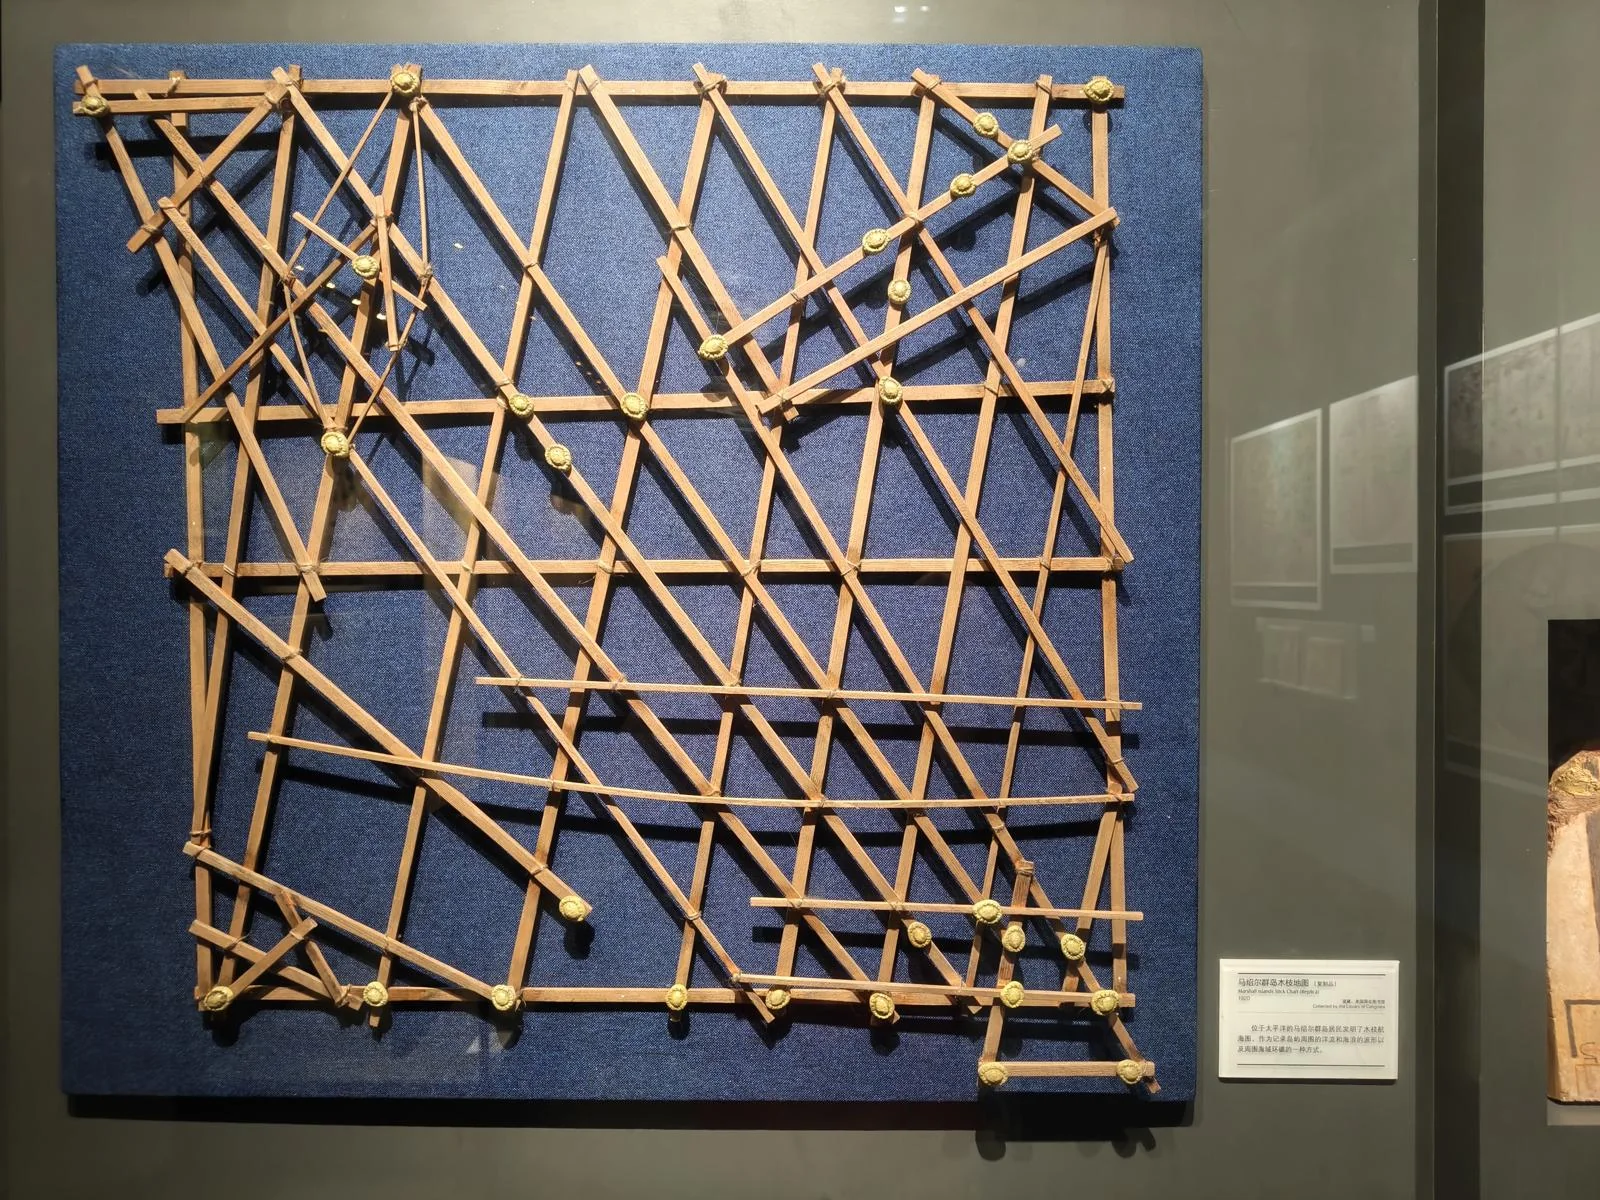
The people of the Marshall Islands invented sea charts made of bound sticks.
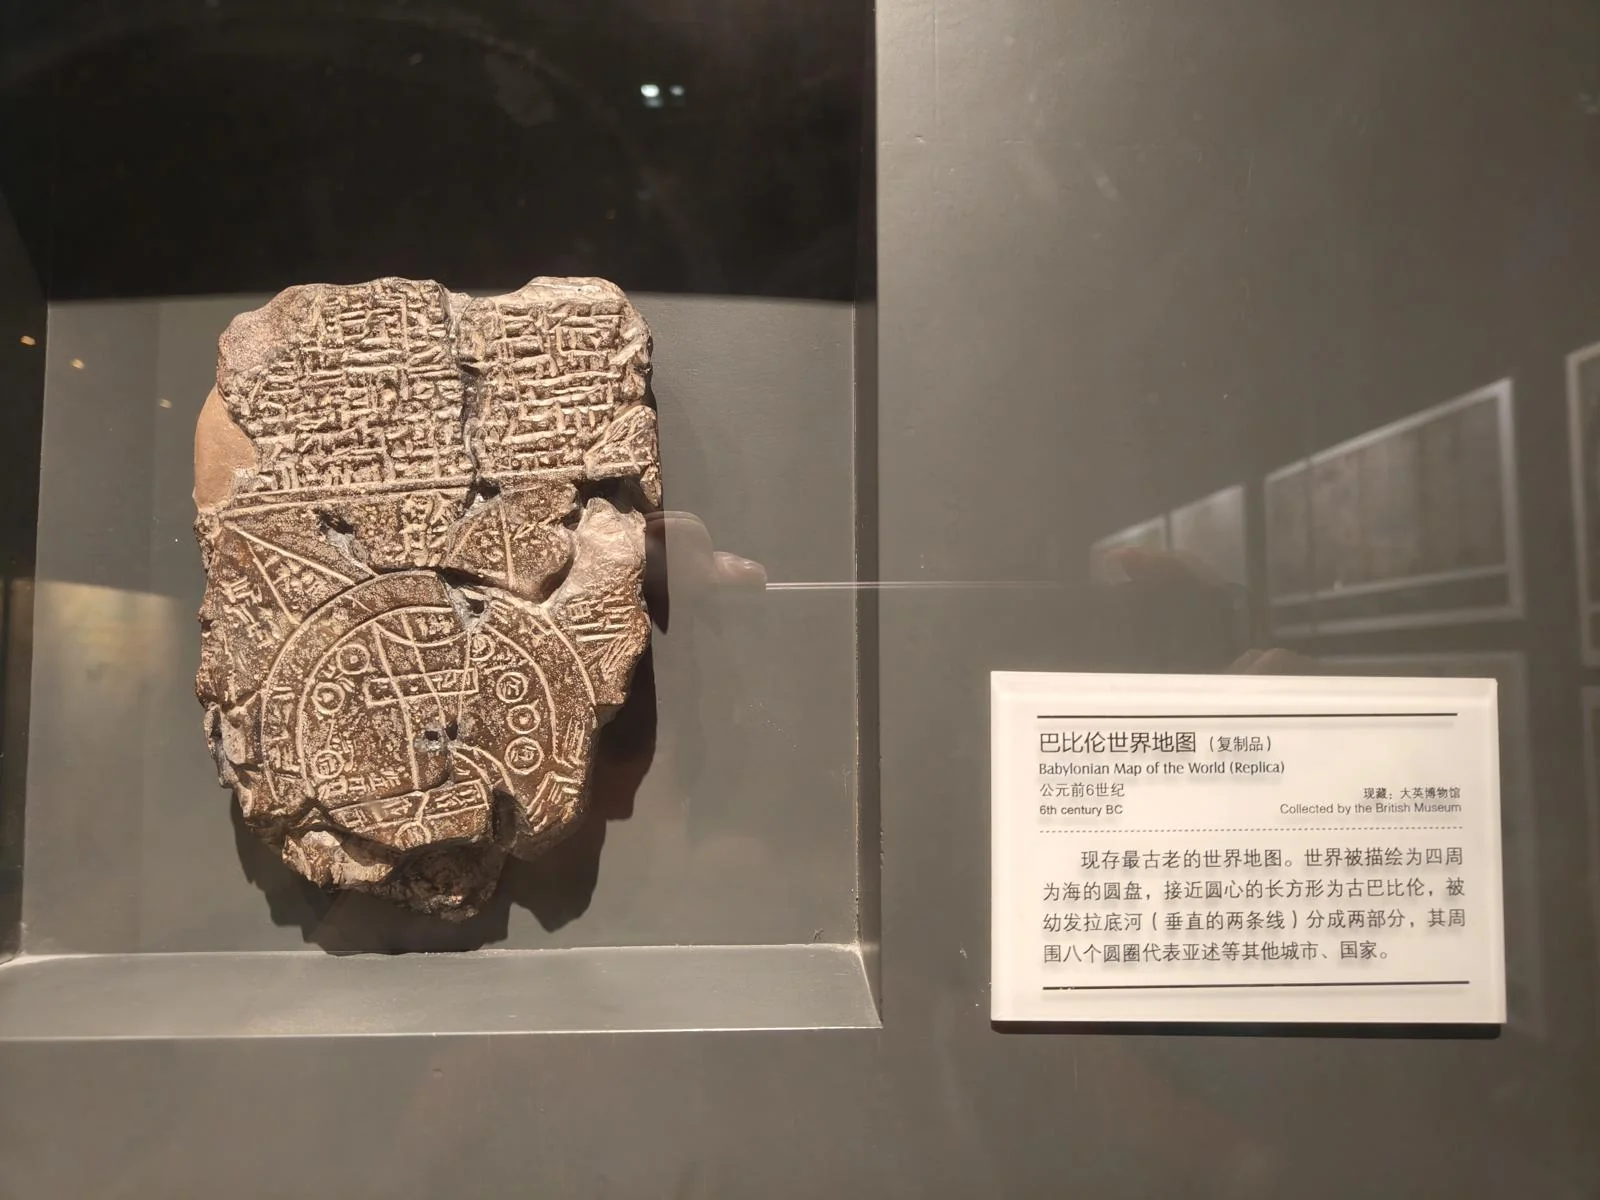
A Babylonian stone-carved world map.
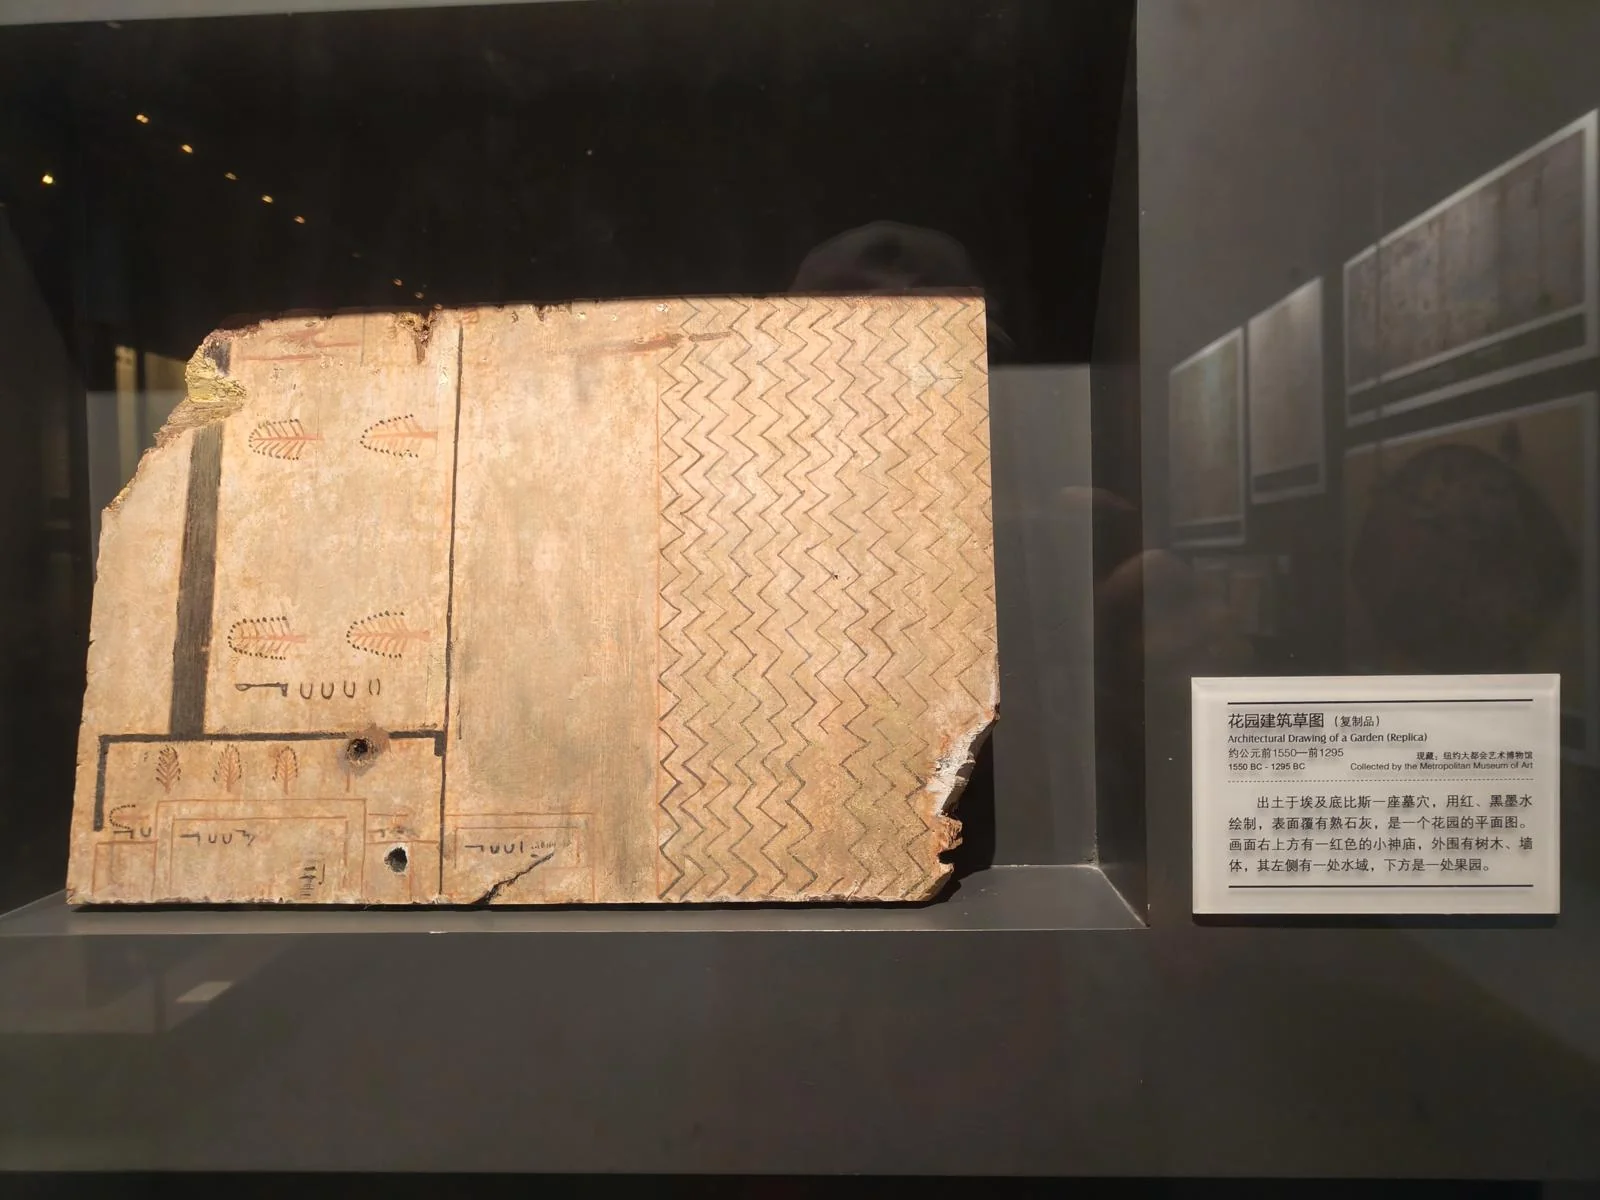
A floor plan of a garden from a tomb in Egypt.
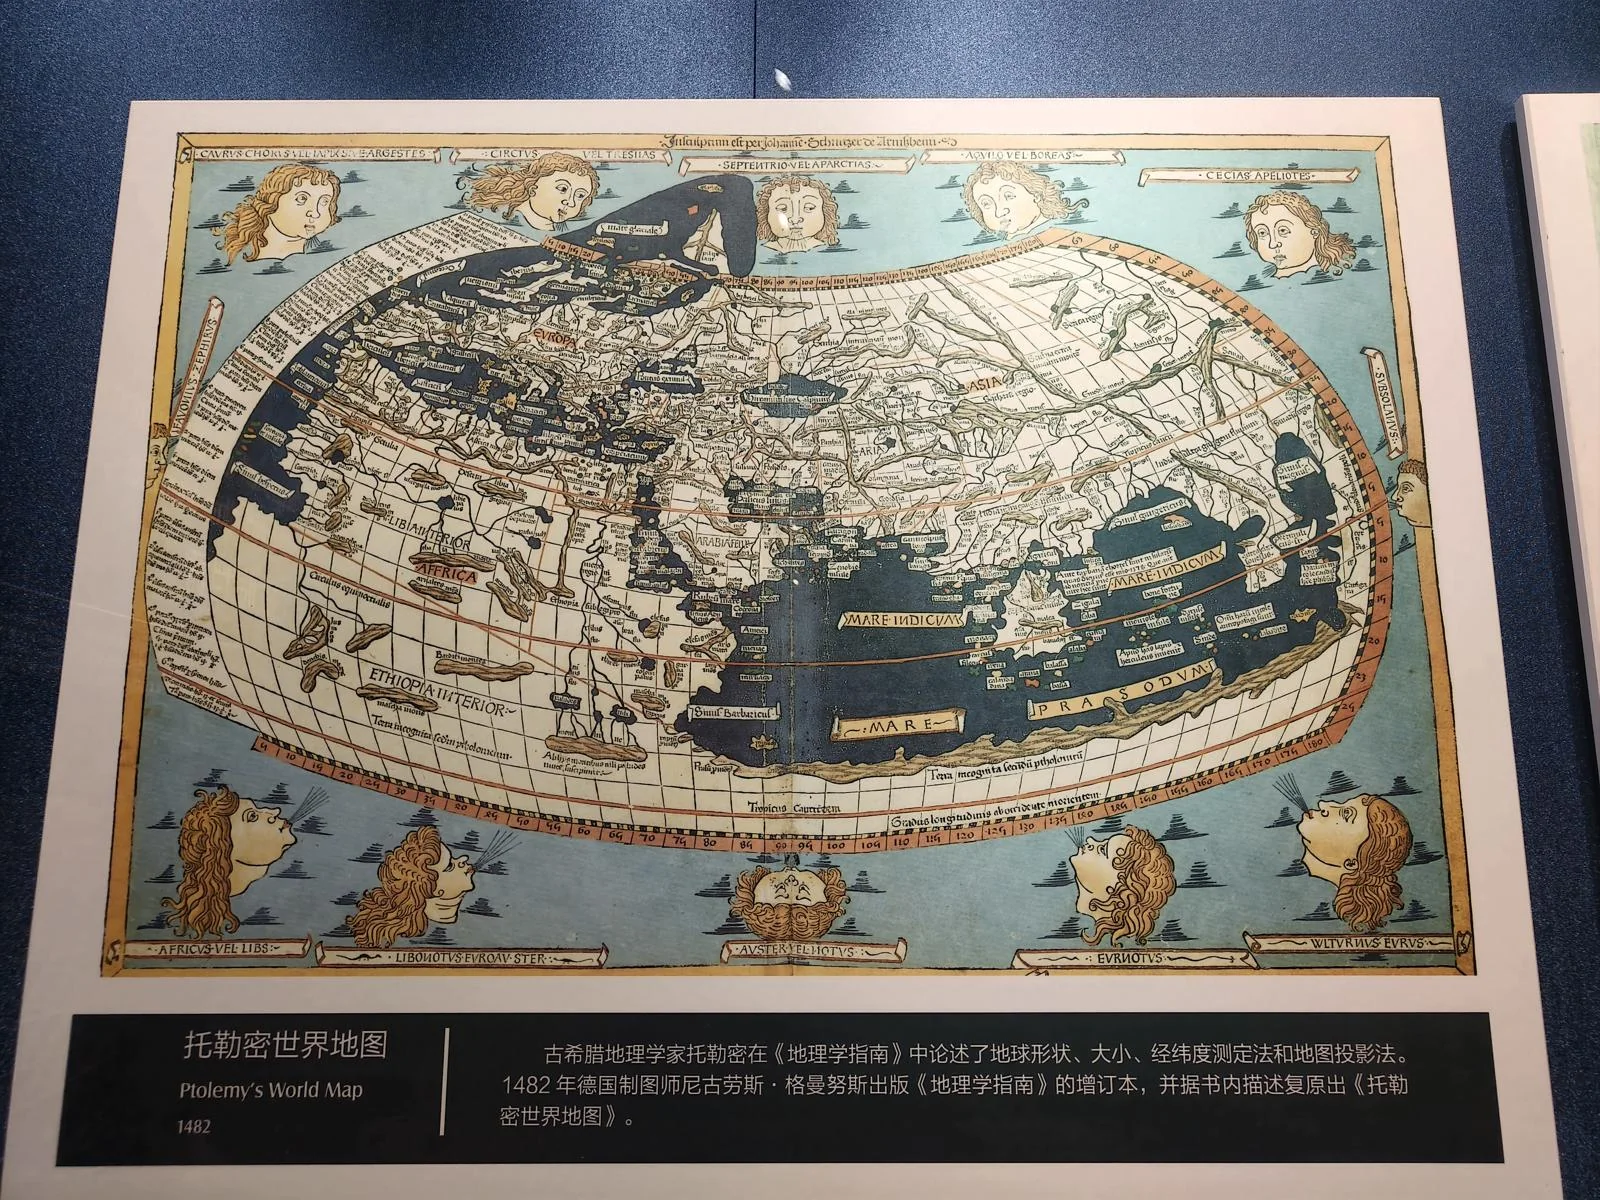
Ptolemy’s world map.
Ptolemy is famous for his geocentric model. Modern people, accustomed to the heliocentric model, often see him as a figure of ridicule, but that’s a Whiggish perspective to be avoided. Ptolemy actually made enormous contributions to astronomy and geography.
In geography, he was a great synthesizer of past knowledge. On his map, he used innovative projection methods and rigorous math to represent the spherical Earth on a flat plane with minimal distortion. It was the most comprehensive and accurate map of its time. He also established a precise latitude and longitude system, correlating Earth’s coordinates with those of the celestial sphere.
Ironically, his map contained a major error. He underestimated the Earth’s circumference by nearly 30% (Eratosthenes’s earlier calculation was off by only 2%). He also overestimated the east-west span of Eurasia and was, of course, unaware of the Americas. On his map, it looked like only a narrow sea separated Europe from the Far East. Because of Ptolemy’s immense academic influence, his flawed map was taken as gospel and, by a twist of fate, helped inspire the Age of Discovery.
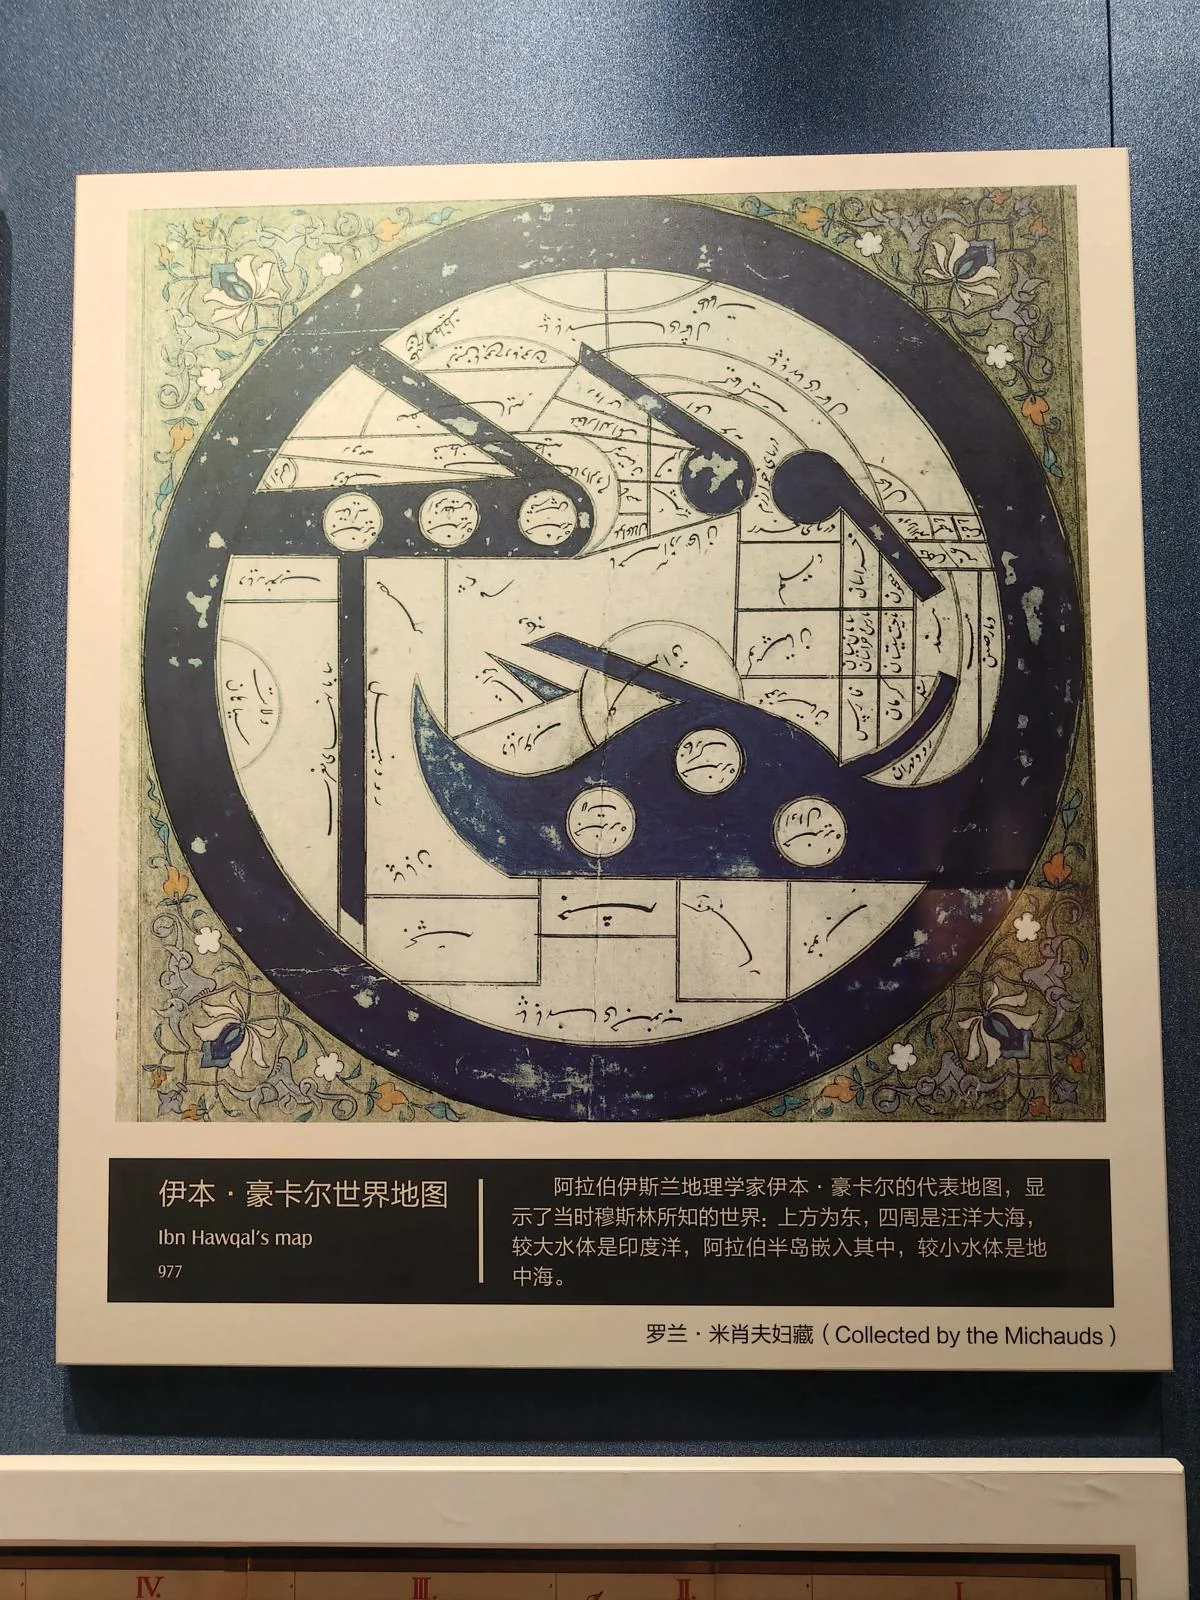
An ancient map from the Islamic world, full of the atmosphere of the Arabian Nights.
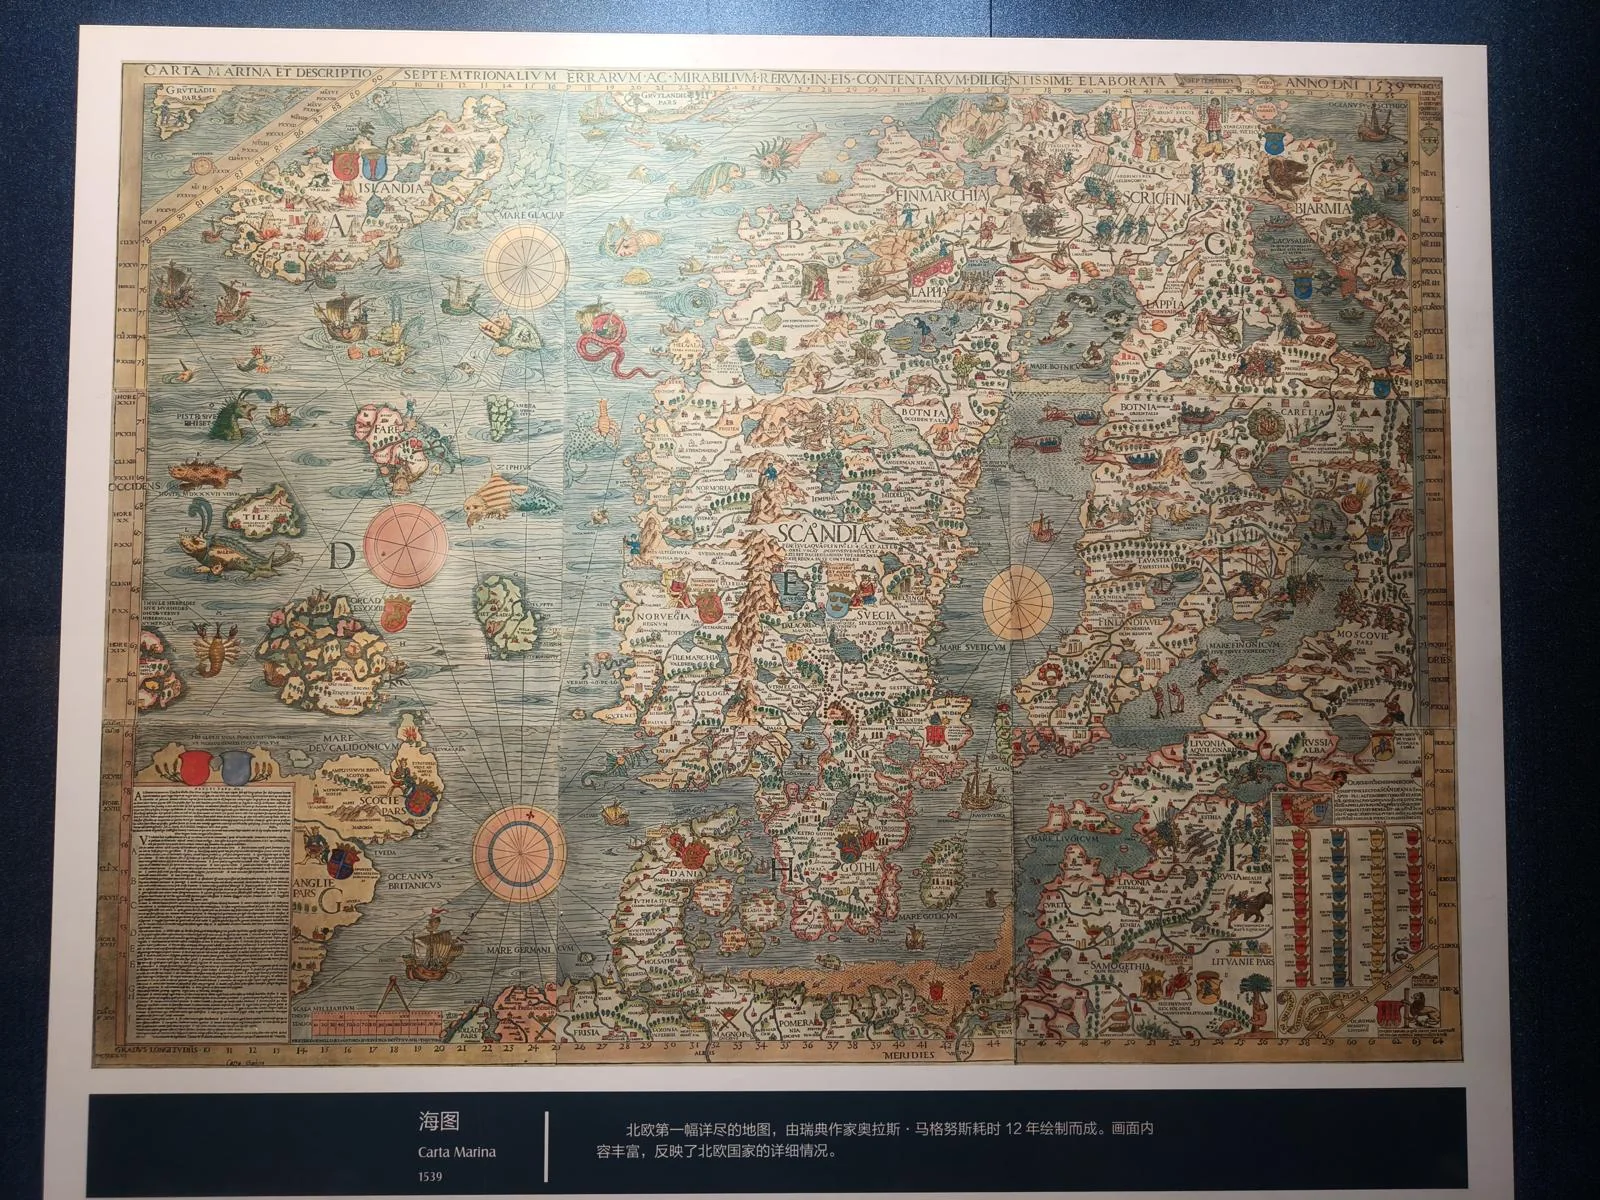
The first detailed nautical chart of Northern Europe.
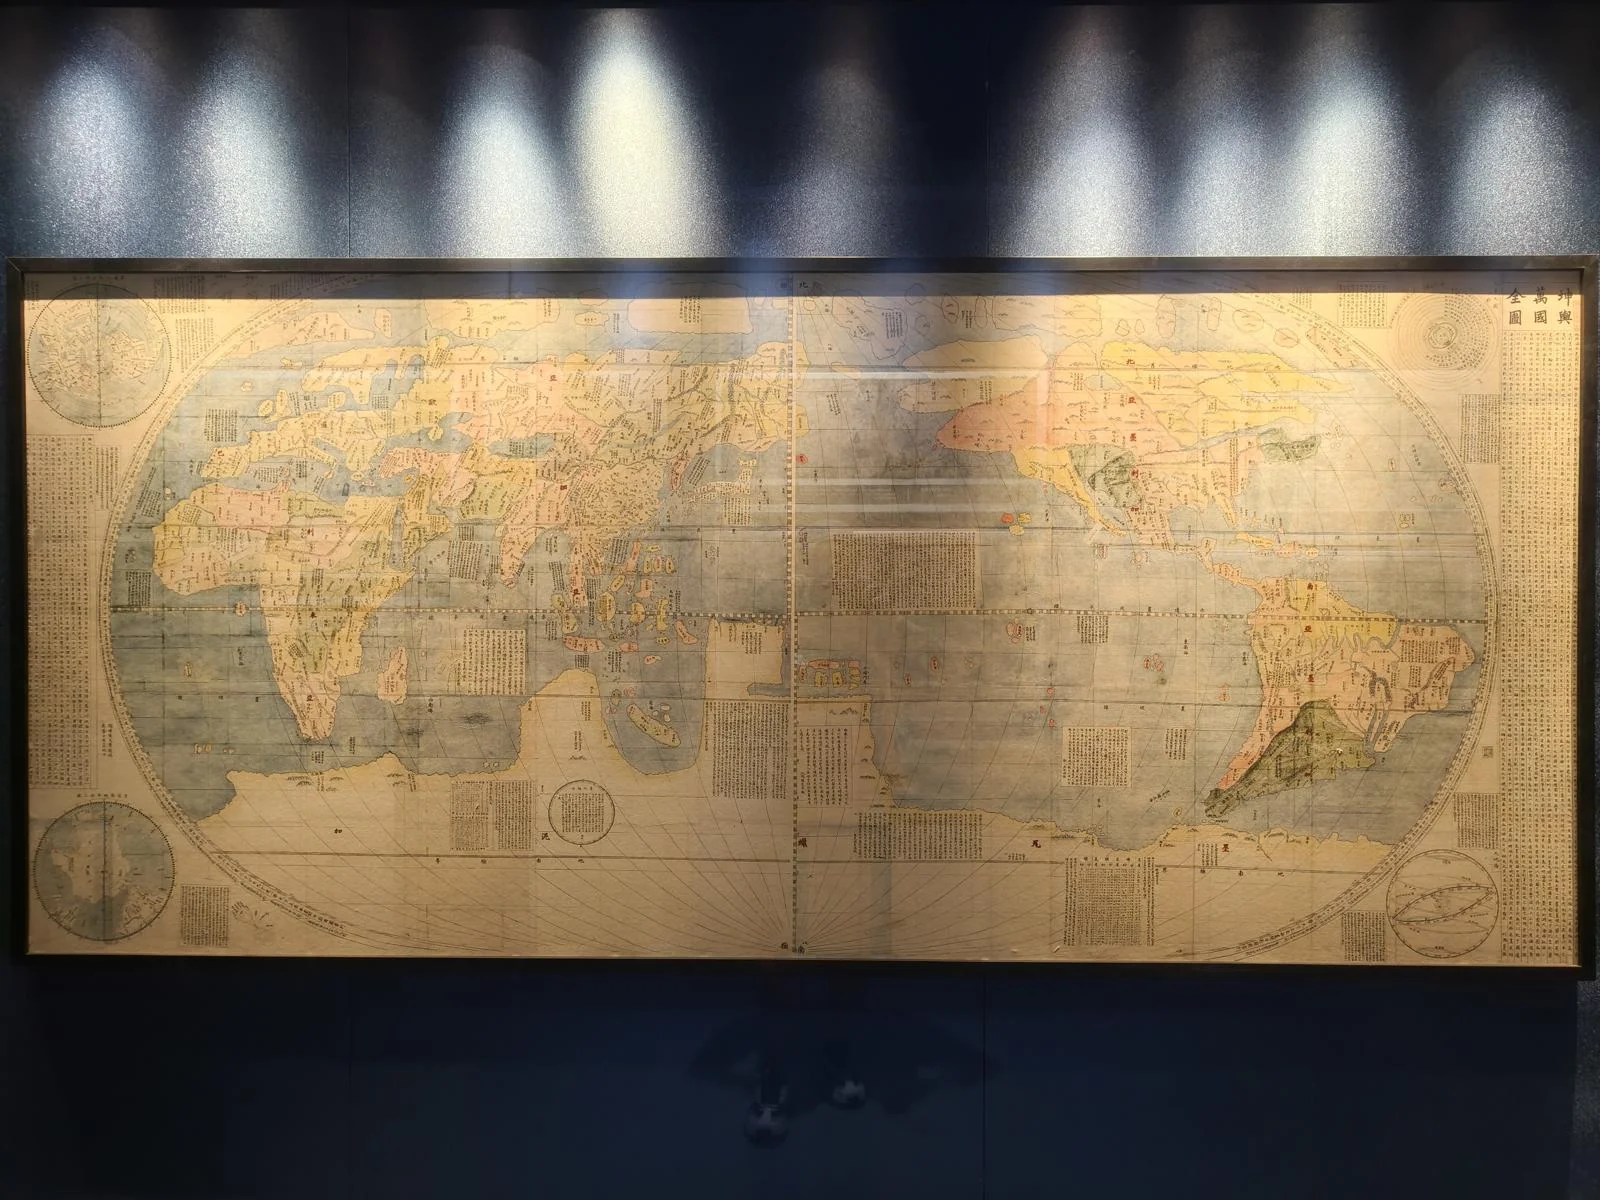
The Kunyu Wanguo Quantu (Map of the Myriad Countries of the World), was drawn in Ming Dynasty Beijing by the Italian missionary Matteo Ricci. It was China’s first map with complete longitude and latitude lines and delivered a huge shock to the prevailing Chinese view of a flat earth under a round heaven, with China at the center.
To soften the blow, Ricci used a clever trick: he shifted the prime meridian to place China and the Pacific Ocean at the center of the map.
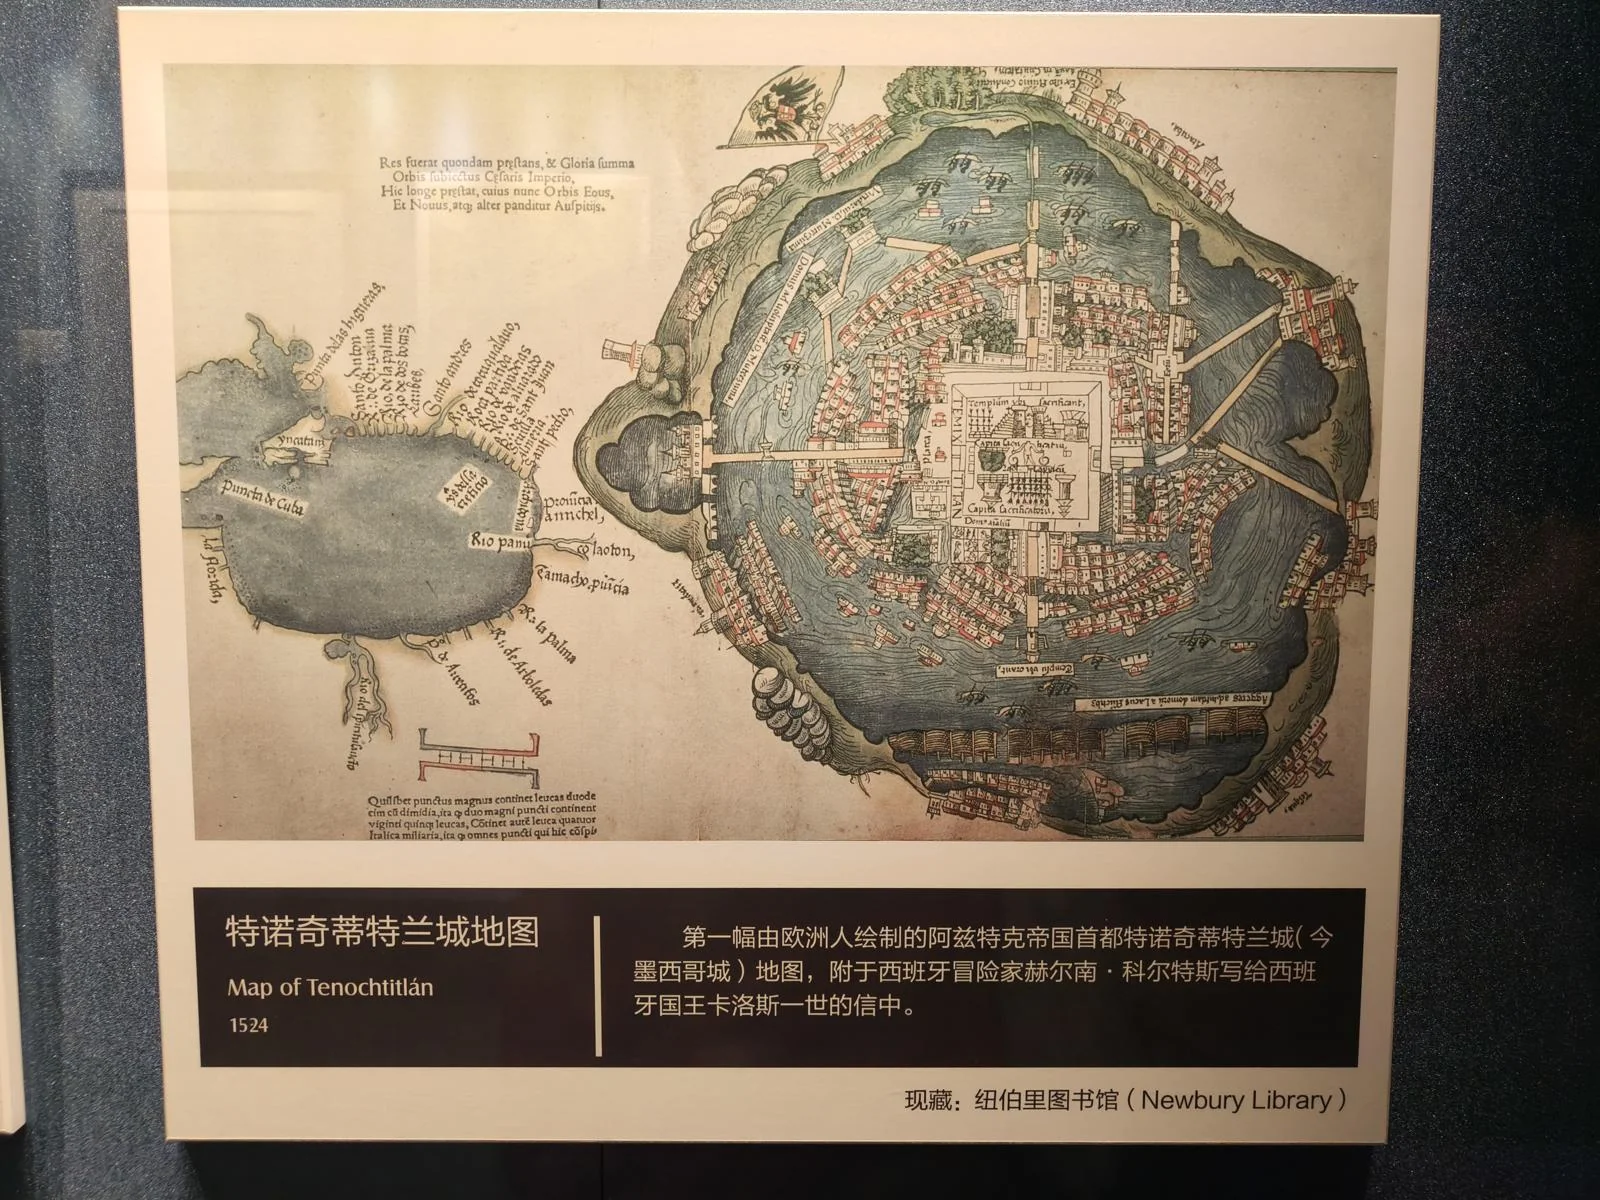
A map of the Aztec capital, drawn by Europeans.
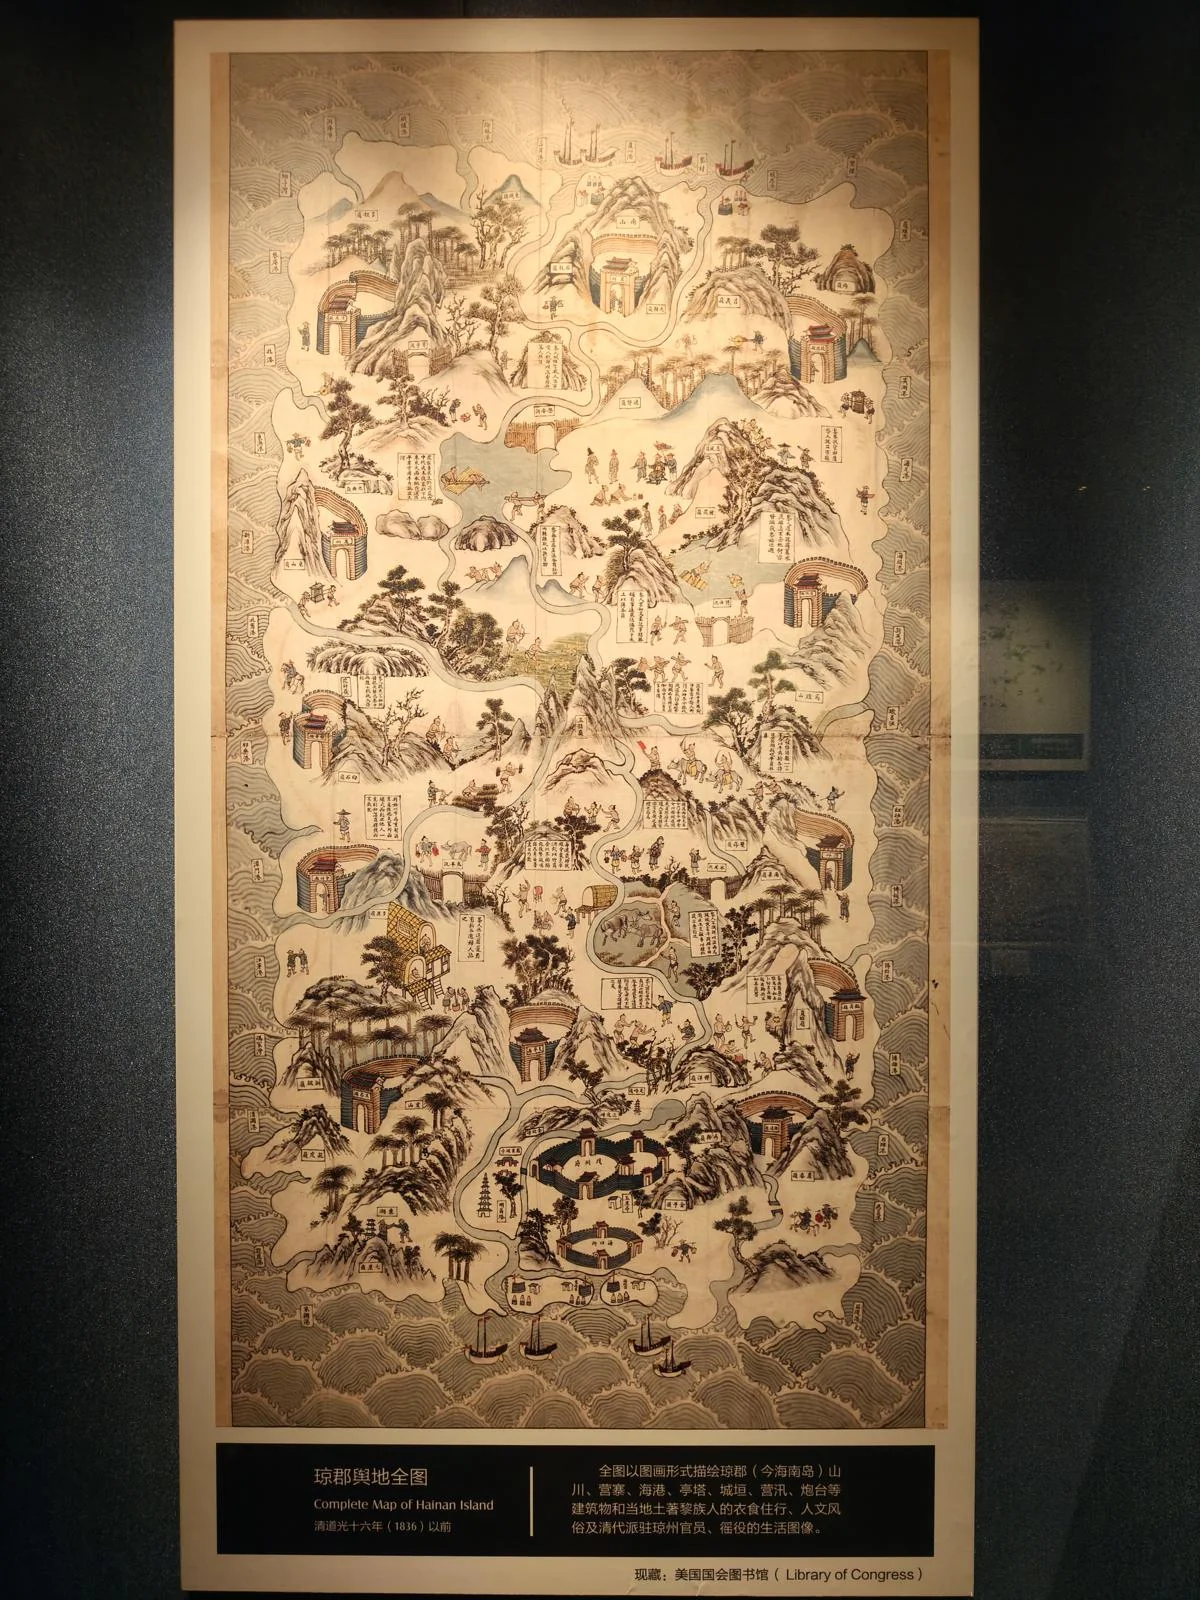
A map of Hainan Province from the Daoguang era of the Qing Dynasty. Frankly, many modern tourist maps aren’t this beautiful.
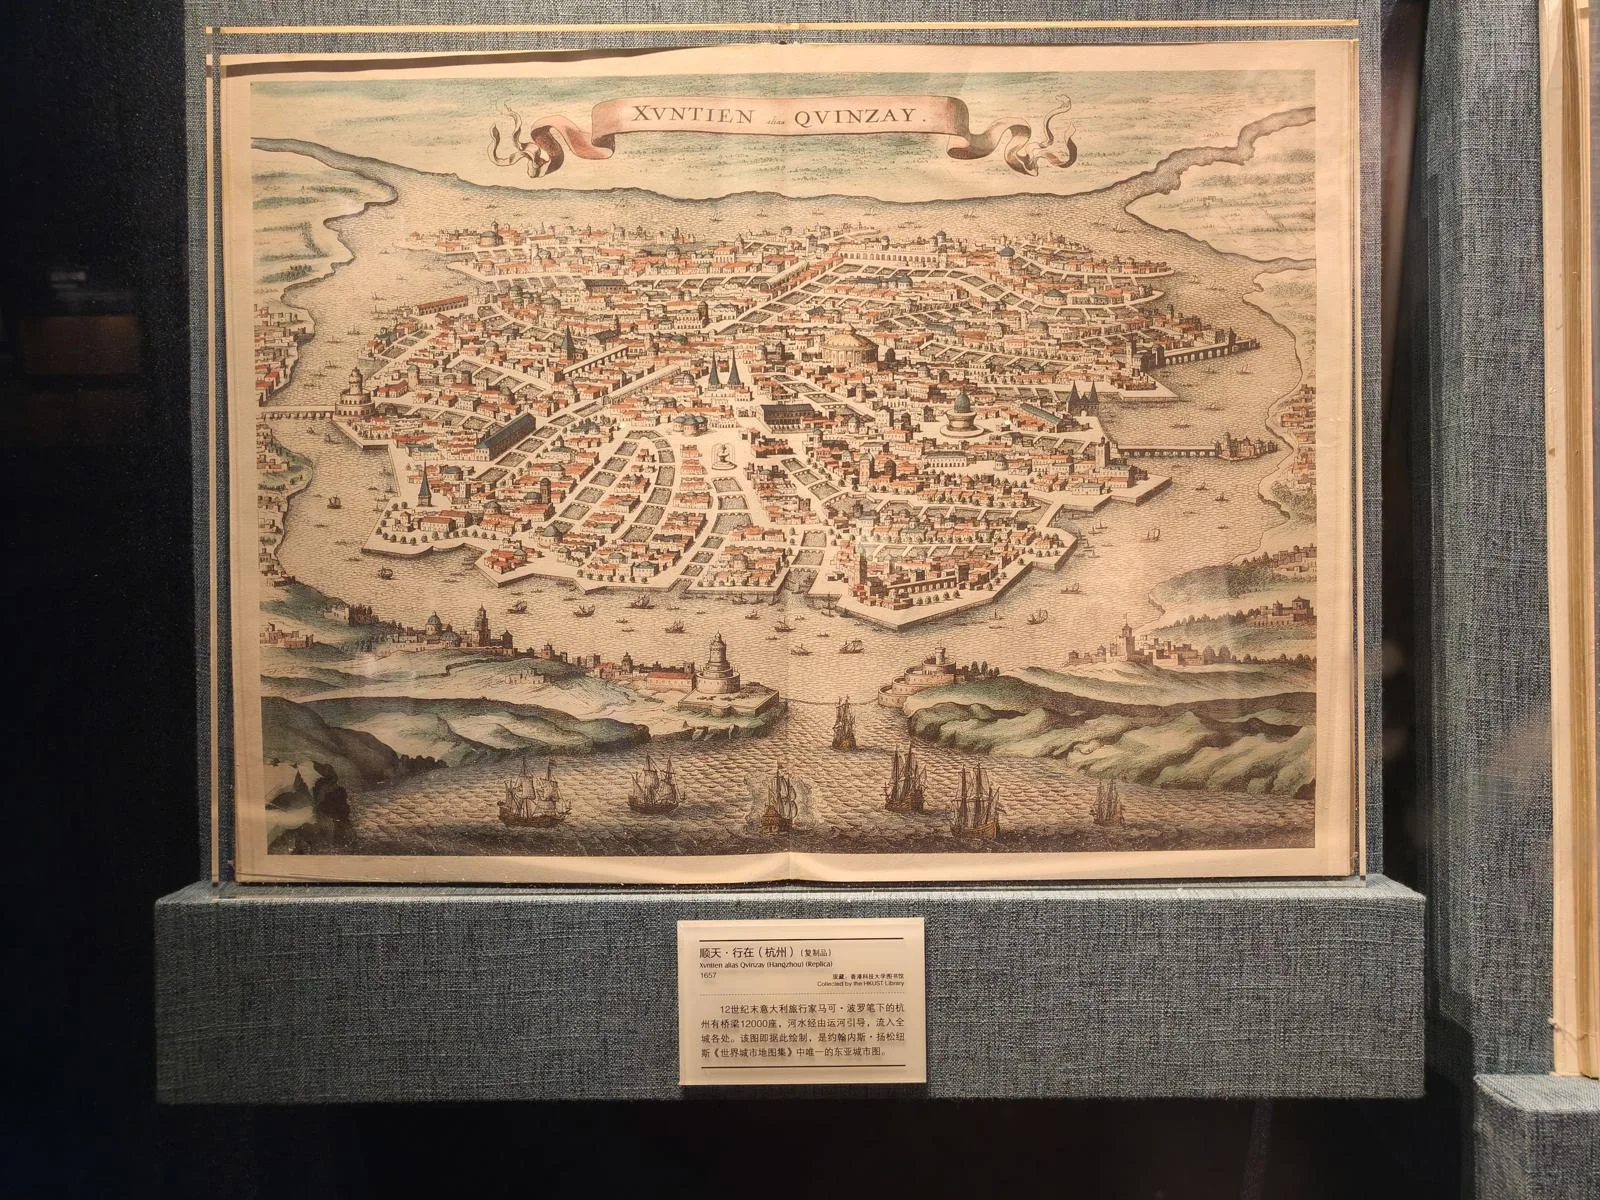
An old map of Hangzhou inspired by Marco Polo’s travels. It comes from a Civitates Orbis Terrarum (Atlas of the Cities of the World) and is the only East Asian city included.
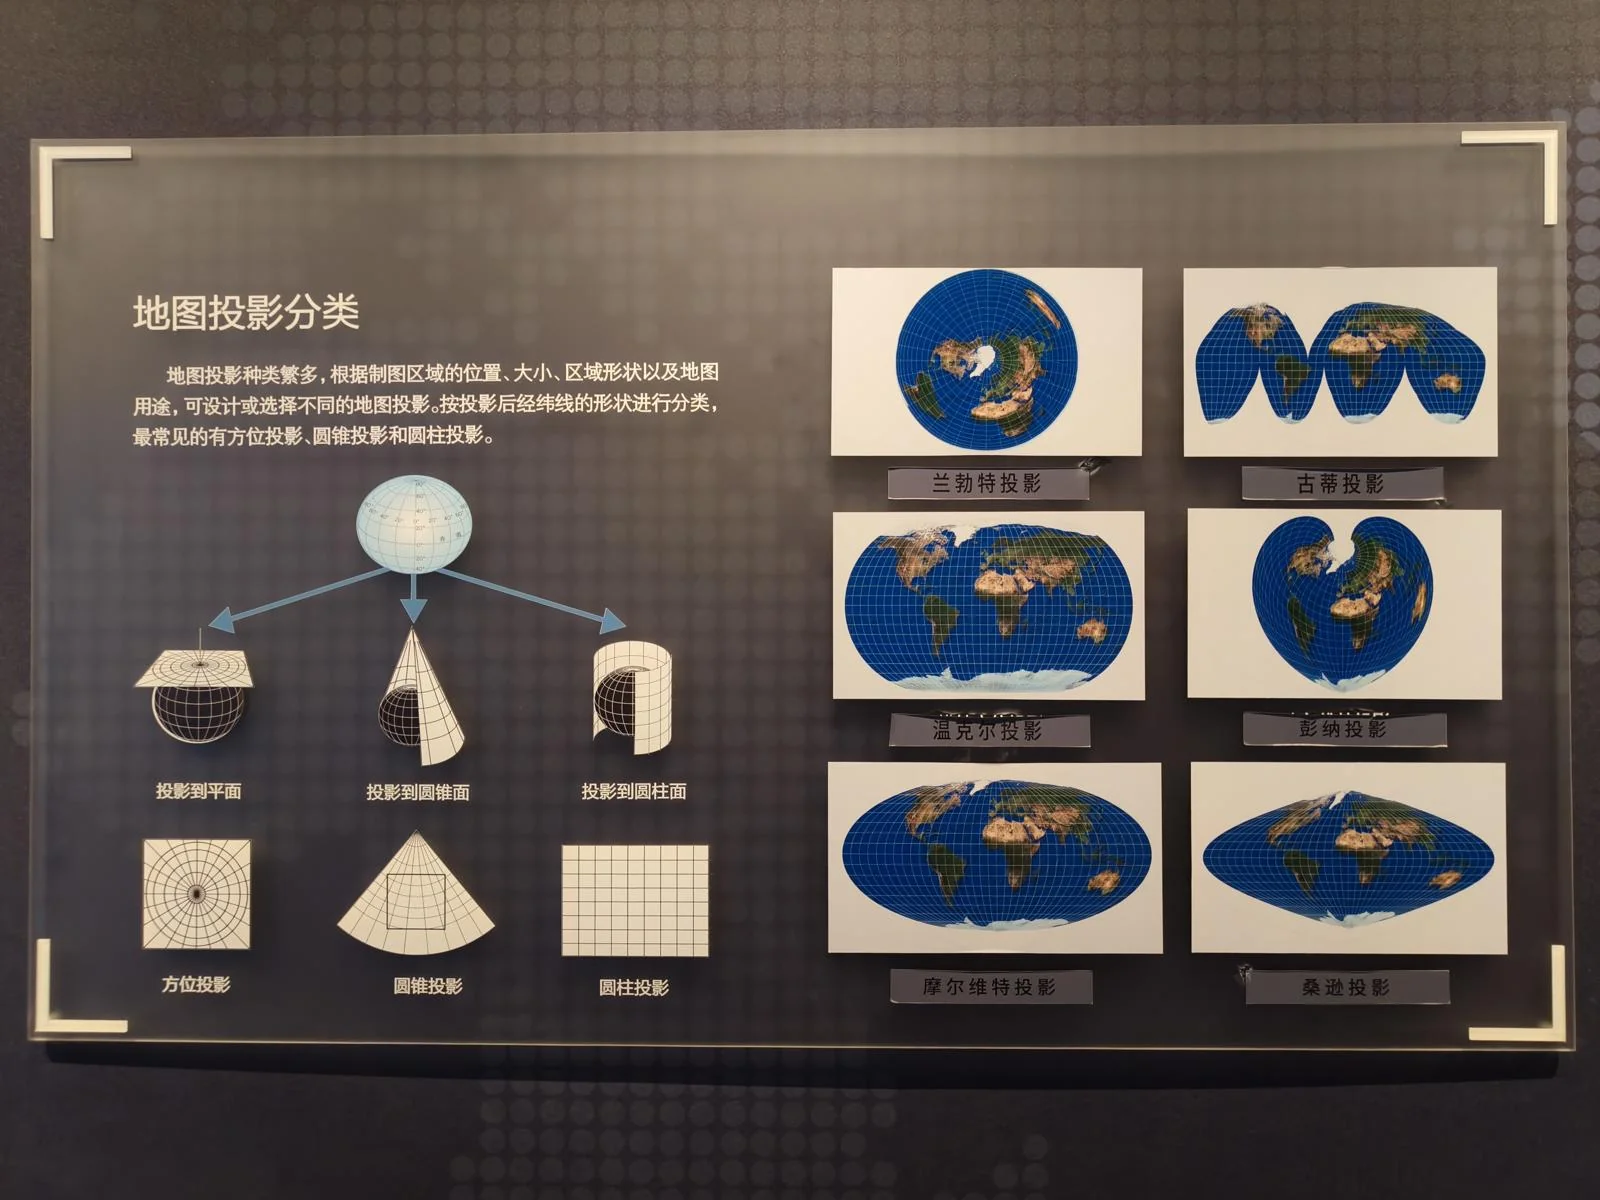
After the map appreciation, I came to another section of the map hall, which mainly talked about the various aspects behind maps, such as projection methods, and the relationship between maps and national sovereignty.
Due to time constraints, I only snapped a few photos about map projections before leaving in a hurry.
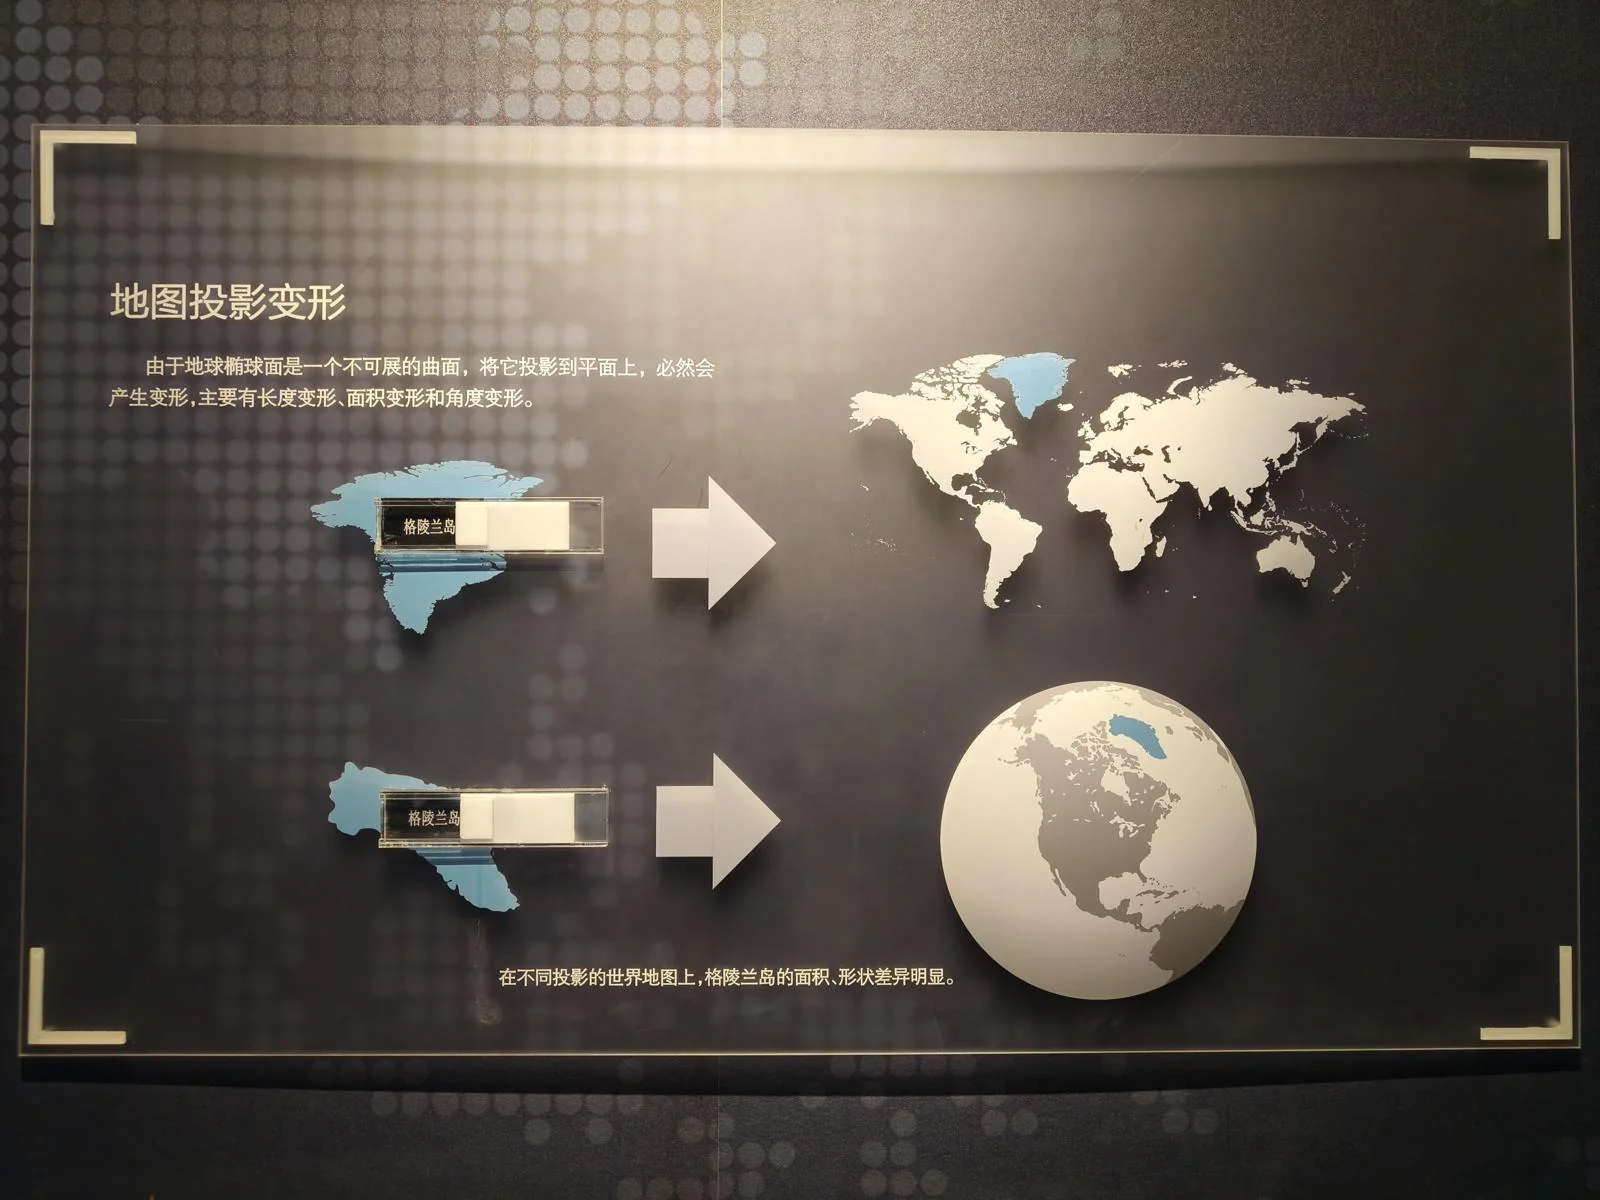
The most common projection today is the Mercator, shown above. Its problem is that it drastically enlarges high-latitude areas, making Greenland look nearly the size of South America. Comparing a map to a globe makes this distortion obvious.
Afterword
I left buzzing with excitement. I’d truly discovered a hidden treasure. A second visit is definitely in order; there’s so much I didn’t have time to properly appreciate.
The museum’s structure is very clear: it starts with the history of surveying, delves into the technology, and ends with the products—GIS and maps. The logical flow is impeccable. It’s a very high-quality museum.
It’s just so low-key. I suspect the name holds it back. But if you’ve read this far, I’m sure you’re interested. If you get the chance, go see it for yourself.
Visitor Tips: The museum is free but has no parking. You can find street parking a few blocks north, or park at the Alibaba Digital Ecology Innovation Park, a 5-10 minute walk away. This park, once Alibaba’s closed headquarters, is now an open campus for e-commerce companies. There are no walls or gates. You can park there (for a fee), and the cafeteria is open to the public (though possibly not on weekends). If you want to spend a whole day at the museum, it’s a great place to take a lunch break.
Finally, I recommend the BBC documentary Maps: Power, Plunder and Possession. Its topic is highly relevant to the second half of the museum. Watching it beforehand will make your visit even more rewarding.