I heard Marketing was tearing their hair out. The boss greenlit the new course cover design, and now they needed to update all 800+ existing covers. It wasn’t a simple find-and-replace; there were tons of small differences. Marketing has only one designer, and they were slammed. Doing it in-house? No way. Outsourcing would cost 20 RMB per image, totaling 16,000 RMB – a budget buster.
Bingo! 16,000 RMB? My ears perked up. I love automation. A data geek who knows Photoshop? This was my moment. People talk about the “value of design.” But what is your value? How do you put a number on it? Saving the company a designer’s monthly salary in half a day? That’s real value. Plus, it’d be great for my year-end review. I jumped on the task.
The Challenge

This is the template the marketing designer created. No use criticizing – the boss wanted this style. Simple. The basic need was also simple: replace three text areas and generate 800+ images.
Most designers would think, “Piece of cake! Define some variables in Photoshop, create an Excel sheet, and batch export.”
If you don’t know how to batch output with Excel and Photoshop, check out this tutorial: https://zhuanlan.zhihu.com/p/33725280
Yeah… that’s the gist. If it were that easy, you could just follow the tutorial, and this article would be done.
But, once I saw the template, I realized it was much trickier. The variations were crazy:


- Over a dozen course categories, some with unique backgrounds, others sharing.
- The top category wasn’t always text. Two (Taobao and Tmall) used logos – images.
- Course titles: one or two lines. Single-line titles needed vertical centering.
- Text color changed with the background – a tinted shade, not pure black.
- The bottom description text wasn’t always there. If missing, its decorative box had to go too.
- The box’s line color also changed, matching the text but brighter.
Think. Could you handle this with Photoshop variables? Sure, you could make a dozen PSDs. But I wanted just one.
Yes, it was possible.
But it needed a designer who was also an Excel expert.
Designing the Excel Data Model
The complexity meant I needed to think about the data model first.
Programmers might laugh. “Data model? For a simple image?”
Don’t @ me! I’m just using the idea. Look, if you just want to finish, anything goes. But for top efficiency, you need a data model mindset. What’s that? The operations team fills in the least info, and I do the least work per export. This was ongoing, so I needed low marginal costs. The initial setup could be complex; that cost was less important.
So, what columns did we need?
- Course Category
- Course Title
- Description
- Background Image
Obvious ones. Adding the variations, the real list was:

- Filename: Controls the output filename, arranged logically.
- categories: The dozen-ish categories, shown at the top, determining the template.
- Title Line 1: Titles can be one or two lines, split for manual line breaks.
- Title Line 2: Optional; if blank, it’s a single-line title.
- Description: The optional keywords, determining if the box below is shown.
- Taobao: Yes/no, toggles the Taobao logo, based on Category.
- Tmall: Yes/no, toggles the Tmall logo, based on Category.
- Single Line: Yes/no, controls the single-line title layer, based on Title Line 2.
- Two Lines: Yes/no, controls Title Line 1 and 2 layers, based on Title Line 2.
- Has Description: Yes/no, controls the description box, based on Description.
- Background Image: Path for the background image.
- Foreground Color: Path for the color image, used for title text color.
Explanation: I had three title layers. One for single-line, two for two-line titles.
Giving this to operations would be brutal. Most could be calculated. Operations only needed: Category, Title Line 1, Title Line 2, and Description. I made an online spreadsheet with just those four and sent it out. We had 5-6 people working, each taking categories. They finished fast.
The hard part was mine: calculating the rest, all needed for Photoshop. None could be skipped. Category was key. It determined the logos, background, text color, and filename sorting. So, I made a separate Category table, a dimension table, where each category was like a product. The image content table was the fact table, like an order. Category name was the dimension table’s primary key, a foreign key in the fact table, pulling in category info. One fact table (CSV) and one dimension table – a simple star schema, or maybe “Earth-Moon schema”?
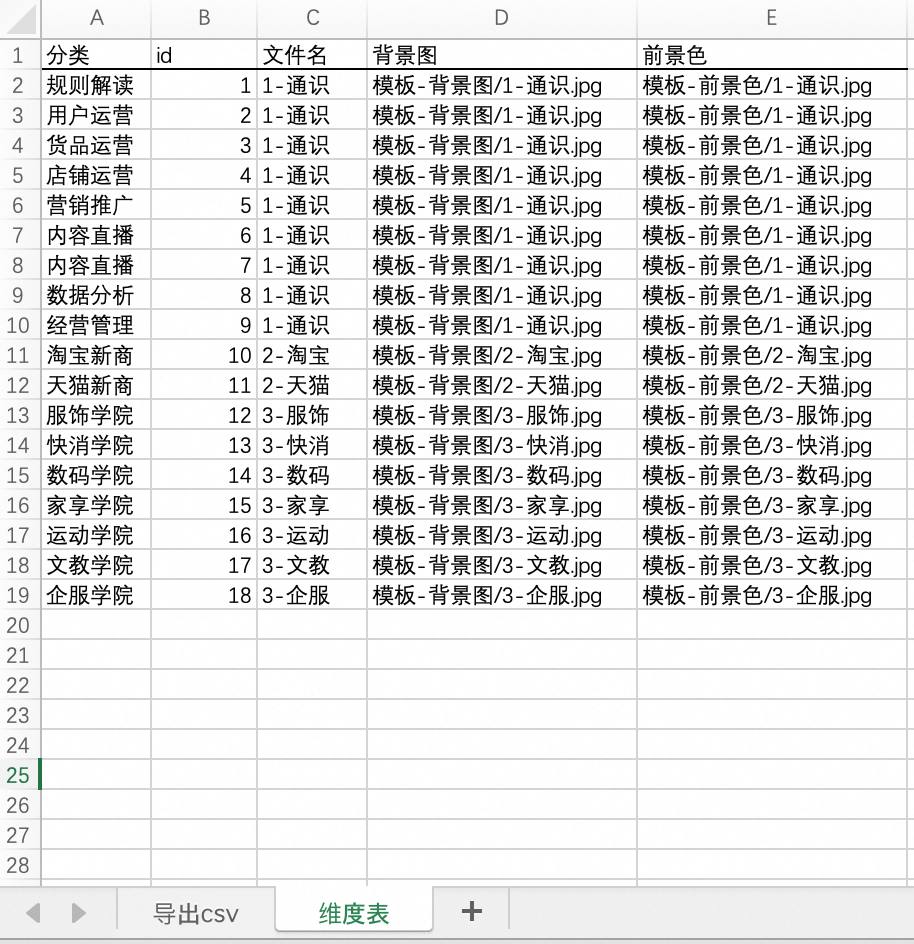
These concepts are from data modeling and databases. Simply, it’s defining attributes on Category. Anything in a category would auto-read the background, color, etc., based on the name. This matched the requirements.
All the operations data (4 columns) was now in my Excel. I referenced it, added the calculated columns, and formed a complete table. I updated, saved as CSV, and gave it to Photoshop.
These calculated columns tested my Excel skills:
vlookupwas crucial for looking up category attributes.- Filenames needed text concatenation. I could combine them freely, deciding the output order.
- I used string replacement to remove spaces in titles, ensuring centering even with accidental spaces.
IFchecked for empty values, preventing 0 on empty rows.
These are easy for Excel users, so I won’t detail them.
Merging Tables with Power Query
But, two questions remained:
- How did operations’ data get into my Excel?
- How do I update it?

First: The online spreadsheet let people work independently and update in real-time. My table was local because I needed Excel’s Power Query for merging, which most online spreadsheets lack.
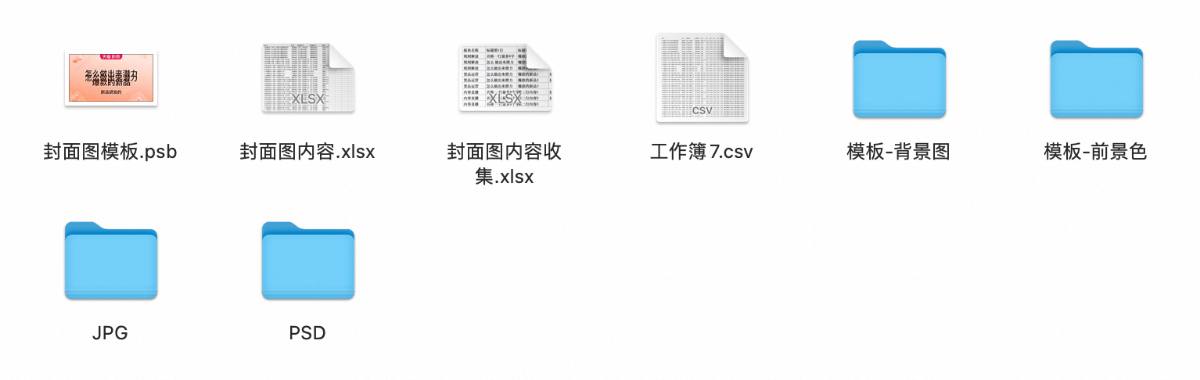
For each batch, I downloaded the online spreadsheet (Course Cover Content Collection.xlsx) to the same directory as my table (Course Cover Content.xlsx). The data link would stay as long as the location didn’t change.

I used Power Query from the “Data” menu. Think of it as a visual SQL. It reads data from local tables, web pages, databases, and Azure, and cleans, transforms, and aggregates it. I used its local table reading.
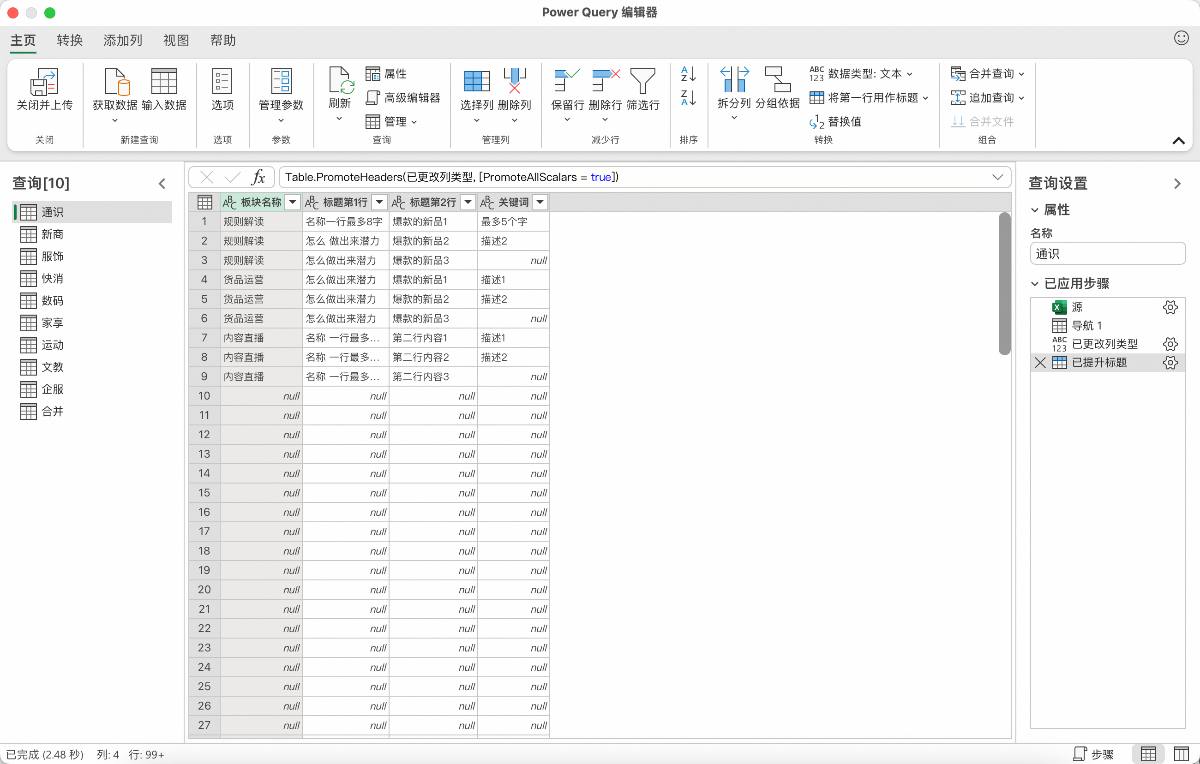
The Power Query interface is both familiar and strange to basic Excel users. Familiar: “Tables!” Strange: “What’s all this?”
Understanding Power Query: It does three things:
- Specifies the data source.
- Sets rules and conditions.
- Executes and loads data, one request per sheet.
Step two is crucial. The left list is a series of requests, executed in order.
Each needs “Use First Row as Headers” and removal of empty values.

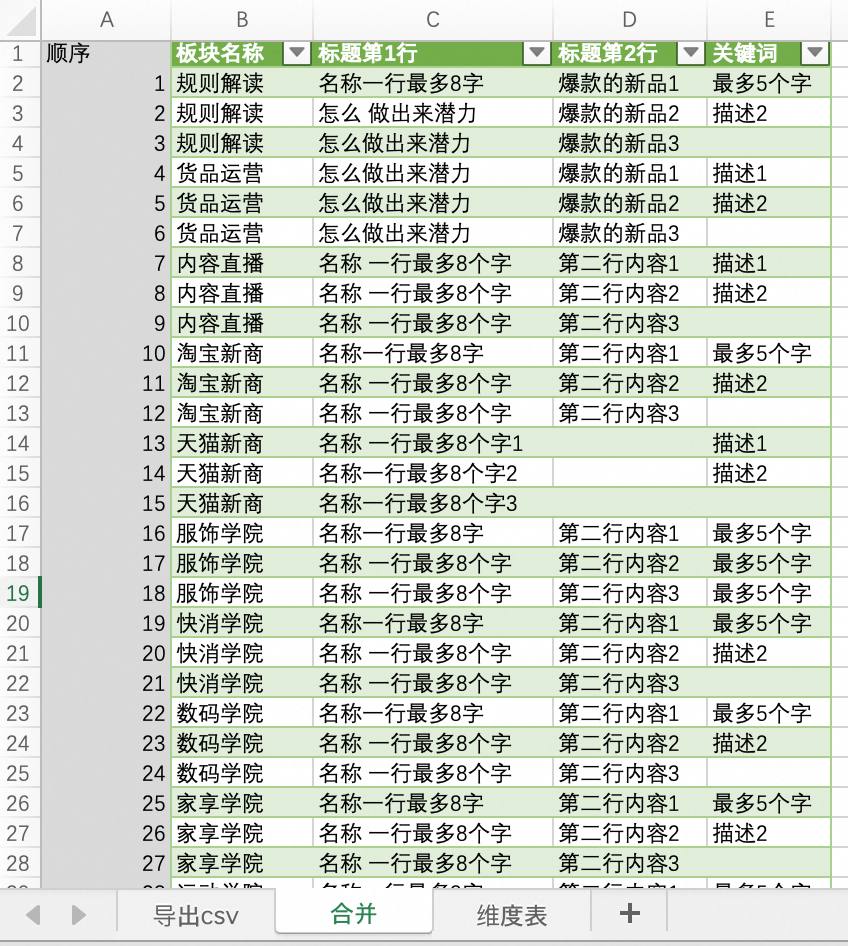
It’s not just filtering and sorting. I used its table merging. Operations’ data was scattered. I couldn’t copy-paste, right? I queried each sheet, then created an append request, combining tables with the same format, like SQL’s CROSS JOIN.

Its merge query is also useful, like SQL’s JOIN and LEFT JOIN.

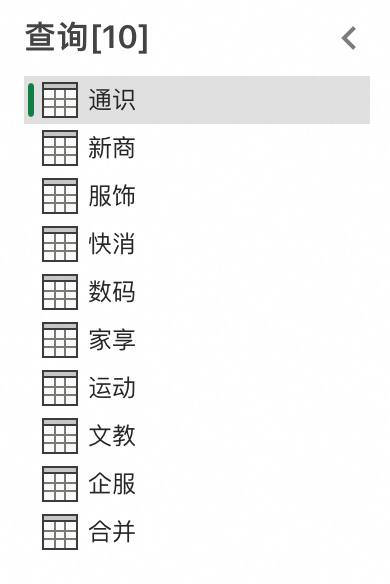
“Close” (actually save) made a bunch of sheets appear. I deleted unneeded ones. I added a sequence number for filename sorting.
All operations data was now in.
Second question: updating?

New batch? Download, overwrite, open the data table, “Data” menu, “Refresh.” Simple.
Why compare to SQL? It records query conditions, not results. Results are shown, but it’s a preview. It records requests and re-queries on “Refresh.”
After complex initial setup, the pipeline was set. Use was simple: download, overwrite, refresh, save as CSV – Photoshop’s data file.
Batch Image Generation in Photoshop
Photoshop had five steps:
- Organize/rename layers.
- Define variables.
- Import data.
- Batch export PSDs.
- Batch convert to JPGs.
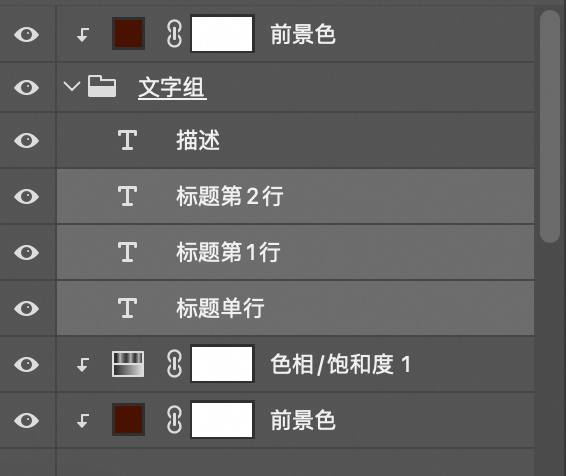
1. Organize and Rename Layers
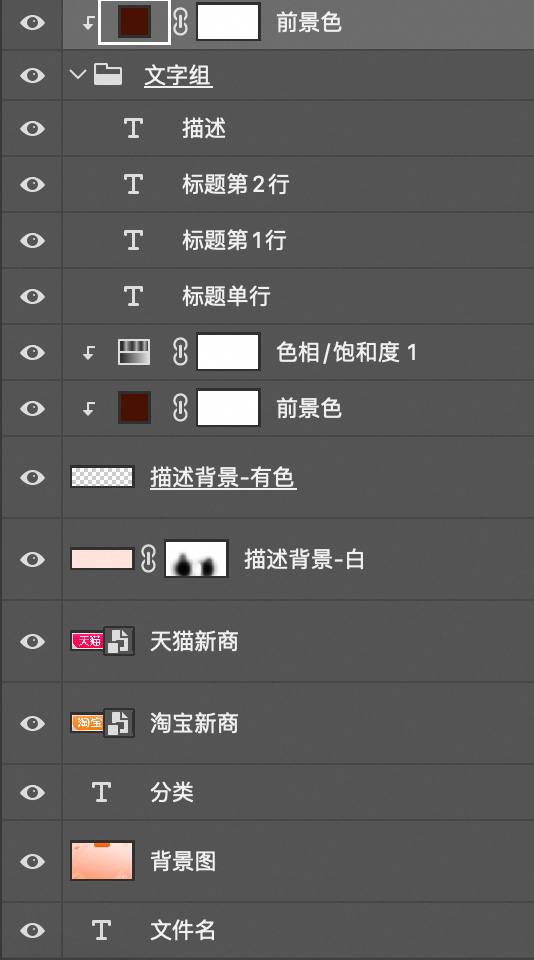
Not hard. Merge, reorder. Name layers according to table headers for easier variable definition.
“Filename” is special; it’s not visible. I created it manually. Style doesn’t matter. Hide it.
“Foreground Color” needed special handling. Variables can’t directly change text color. For background-based changes: group the text, create a solid color layer, and use a clipping mask. This gives unified control.
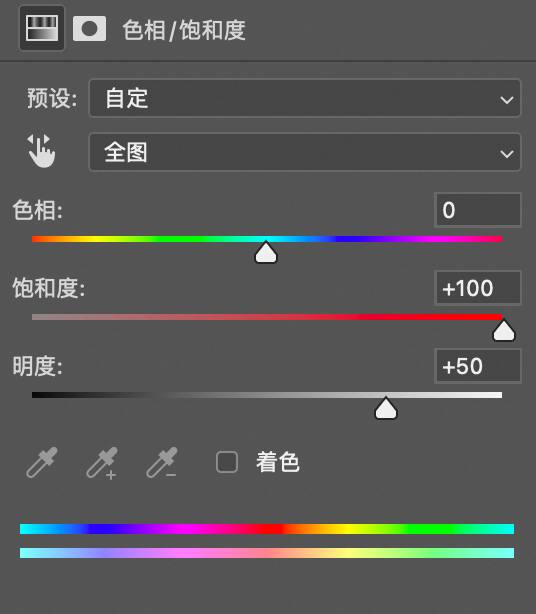
The box’s line color? Related to text, but not the same. Add a Hue/Saturation layer for the lines, increasing saturation and brightness. Brown becomes orange, dark green becomes grass green… This needs color theory and Photoshop knowledge.
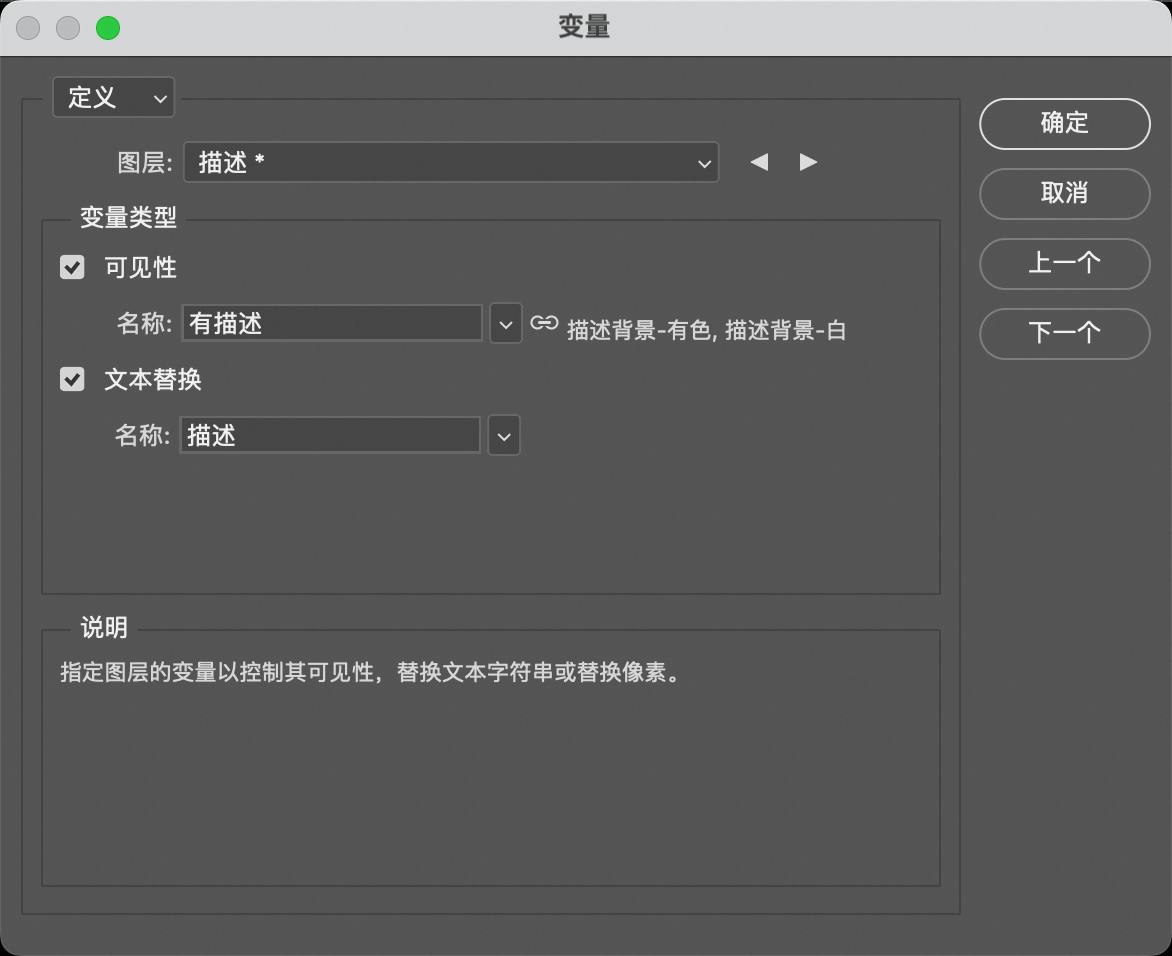
2. Define Variables for Layers
No step-by-step; the linked tutorial covers it. I’ll discuss tricky points.

Common use: “Text Replacement.” Non-text layers become “Pixel Replacement” – image change. Background is replaced this way.
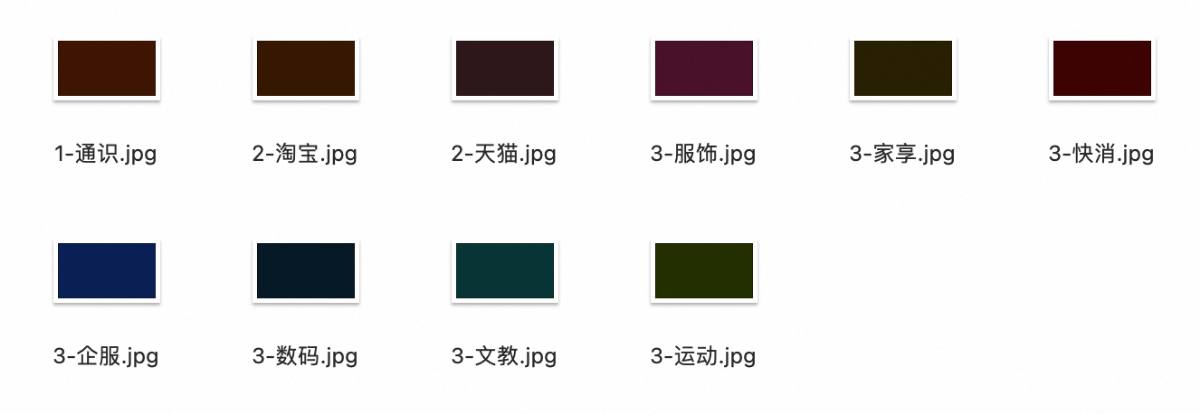
Foreground color is similar. Prepare color images, define the clipping mask as a variable, select based on category.

Visibility variables are useful. TRUE/FALSE control display. Can be used with text/pixel replacement. Description text: text replacement changes content, visibility controls display.
These first two steps, though tedious, are one-time.
3. Import Data Sets

Import the CSV.
Two common errors: extra/mismatched columns, and empty cells. Photoshop doesn’t support empty cells, so I used NULL, with visibility checks.
4. Batch Export PSDs

No trick; do it like this.
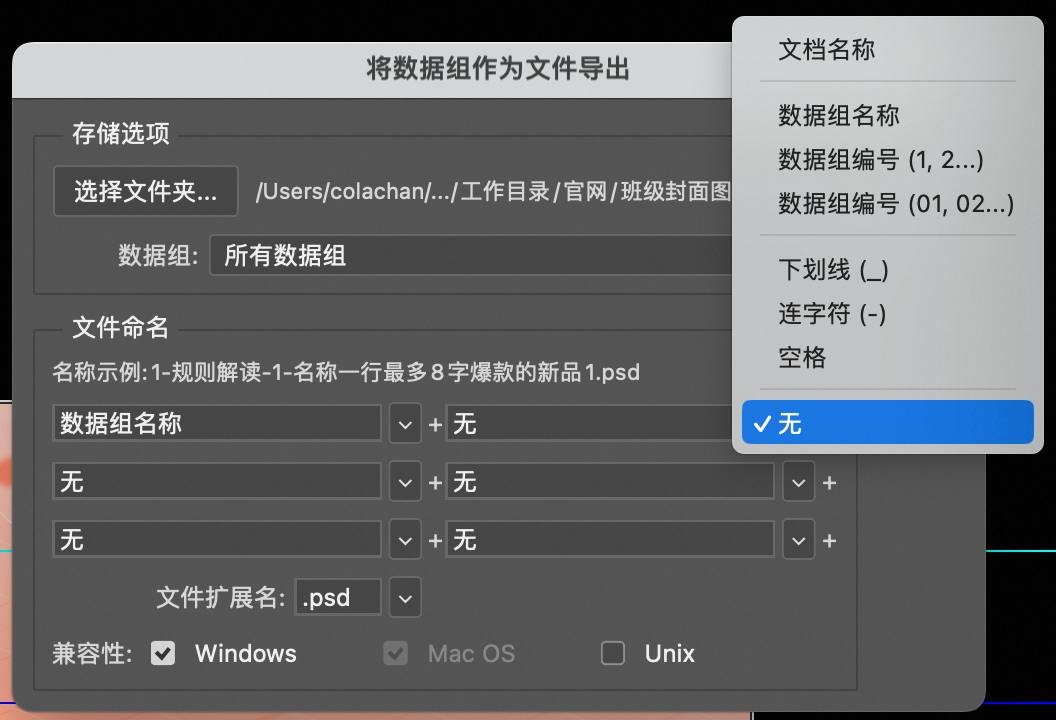
Define filename format. “Data Set Name” is useful; it’s the first column, “Filename,” allowing customization.
5. Batch PSD to JPG Conversion
PSDs need conversion.
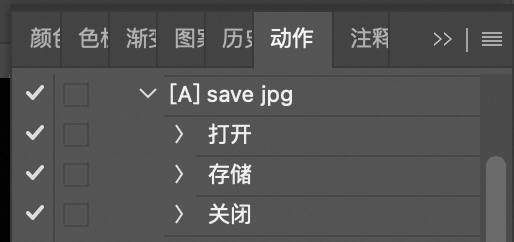
Record a simple action: open, save as JPG, close. Batch process the PSD folder.
My action set has “Save as JPG”; link at the end.
One More Table
Done? Task complete, but not the matter. One crucial table is missing.
These 800+ images (16,000 RMB) are just the first batch. More will come. Shouldn’t I know the yearly savings? Even if I don’t, the boss should.

So, a statistics table, a “bragging table.” Let’s call it “Rock and Roll Table.”
I could even make a chart, showing monthly/quarterly/seasonal value. Subtract from my salary to show my cost – hiring me is a steal! Data is there; whether I do it is TBD.
Epilogue
This was cost-effective. Half a day for initial setup. Negligible time after; I ran it during lunch.
This is my strength. I don’t reinvent wheels, but I assemble them well.
After setup, I met with operations. Marketing explained the four columns. No one found it hard. Operations thought I used AI. For non-tech people, anything amazing is AI. AI is the silver bullet. It’s funny; I’m used to it.
Finally, resources. Try it yourself: